
Poster Abstract Search
- Click to view the abstract and uploaded poster (if available).
- Number of poster abstracts: 44
Changing Snow Conditions are Hindering Wildlife Monitoring and Management (Natalie Boelman)
Theme: Wildlife and Ecosystem Services (Tue 17:00 - 18:00)
- Poster #
34
Todd Brinkman (1), Kalin Seaton (2), Adele Reinking (3), Glen Liston (3), Laura Prugh (4), Calum Cunningham (5), Heather Greaves (6), Natalie Boelman (7)
University of Alaska, Fairbanks (1), Ruby Moon Consulting (2), Colorado State University (3), University Of Washington (4), University of Washington (5), Institute of Arctic Biology (6), Lamont-Doherty Earth Observatory, Columbia Univ. (7)
Throughout the Circumpolar North, the spatial extent, temporal duration, and thickness of snow have declined over the last half-century. The impacts of changes in snow characteristics on wildlife management programs are poorly understood. This is concerning because many wildlife research and monitoring techniques within the ABoVE Domain require certain snow conditions for successful implementation. In Alaska, changes in arrival and persistence of snow are hindering survey techniques used to estimate moose (Alces alces) densities and inform hunting regulations. In collaboration with the Alaska Department of Fish and Game, our goal was to quantify the association between the successful/unsuccessful implementation of moose surveys and modeled snow conditions. We compiled 33 years (1987-2020) of fall moose survey data in six Game Management Units in Alaska. Using SnowModel output, we 1) described the snow conditions required to implement moose surveys and 2) estimated the associations among snow variables and survey success. Assuming trends in snow patterns will continue, we then projected the future probability of successful moose surveys over the next 40 years (2022-2062). We estimated that snow conditions that facilitate moose surveys have arrived approximately one day later per year (on average) over the last 40 years. If these trends continue, using fall aerial surveys to estimate moose density will not be a feasible option across much of Alaska in another 3-4 decades. Our findings may help state and federal wildlife agencies proactively prepare and plan for continued environmental change.
Throughout the Circumpolar North, the spatial extent, temporal duration, and thickness of snow have declined over the last half-century. The impacts of changes in snow characteristics on wildlife management programs are poorly understood. This is concerning because many wildlife research and monitoring techniques within the ABoVE Domain require certain snow conditions for successful implementation. In Alaska, changes in arrival and persistence of snow are hindering survey techniques used to estimate moose (Alces alces) densities and inform hunting regulations. In collaboration with the Alaska Department of Fish and Game, our goal was to quantify the association between the successful/unsuccessful implementation of moose surveys and modeled snow conditions. We compiled 33 years (1987-2020) of fall moose survey data in six Game Management Units in Alaska. Using SnowModel output, we 1) described the snow conditions required to implement moose surveys and 2) estimated the associations among snow variables and survey success. Assuming trends in snow patterns will continue, we then projected the future probability of successful moose surveys over the next 40 years (2022-2062). We estimated that snow conditions that facilitate moose surveys have arrived approximately one day later per year (on average) over the last 40 years. If these trends continue, using fall aerial surveys to estimate moose density will not be a feasible option across much of Alaska in another 3-4 decades. Our findings may help state and federal wildlife agencies proactively prepare and plan for continued environmental change.
Mapping wetland type and seasonal inundation using Synthetic Aperture Radar in the ABoVE study domain (Dorthea Vander Bilt)
Theme: Wildlife and Ecosystem Services (Tue 17:00 - 18:00)
- Poster #
36
Dorthea Vander Bilt (1), Michael Battaglia (2), Nancy French (3), Laura Bourgeau-Chavez (2), Shaniqwa Martin (2)
Michigan Tech Research Institute (1), Michigan Technological University (2), Michigan Tech Research Institute (MTRI) (3)
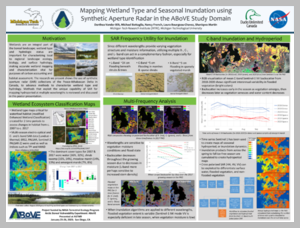
Wetlands are an integral part of the boreal landscape. Wetland type and hydrologic status are important for characterizing local to regional landscape ecology, biology, and surface hydrology, making accurate wetland mapping and characterization vital for purposes of carbon accounting and habitat assessment. Wetlands also provide unique ecosystem services and thereby have great significance for human subsistence in the vast regions of northern North America. This 1.4-billion-acre area is home to 23 species of waterfowl, and the primary breeding region for at least 10 species. The research we present shows the use of synthetic aperture radar (SAR) collections in Northwest Territories, Canada, to 1) generate detailed wetland type class maps to quantify wetland dynamics through type change and 2) advance methods to characterize wetland type and hydrology. Mapping efforts used multi-seasonal moderate resolution optical and synthetic aperture radar (SAR) imagery sourced from aerial and satellite sensors, ground-truthed field data, and calculated topographic and hydrologic indices to differential between land cover types. Time series Sentinel-1 in Google Earth Engine was used to create maps of seasonal hydroperiod, or inundation dynamics, utilizing cross polarized data. Inundation products from across the spring to fall ice-free season were accumulated to create hydroperiod maps. Due to the diverse ecosystems and diverse hydrologic conditions in boreal wetland ecosystems, these wetlands are some of the most difficult landscapes to accurately map. Additionally, the boreal north is experiencing rapid change as the region warms which can have significant effects on waterfowl populations. Therefore, developing robust methods to monitor wetlands for these regions through SAR’s unique capabilities provides an important resource for waterfowl modeling and habitat vulnerability assessments.
Wetlands are an integral part of the boreal landscape. Wetland type and hydrologic status are important for characterizing local to regional landscape ecology, biology, and surface hydrology, making accurate wetland mapping and characterization vital for purposes of carbon accounting and habitat assessment. Wetlands also provide unique ecosystem services and thereby have great significance for human subsistence in the vast regions of northern North America. This 1.4-billion-acre area is home to 23 species of waterfowl, and the primary breeding region for at least 10 species. The research we present shows the use of synthetic aperture radar (SAR) collections in Northwest Territories, Canada, to 1) generate detailed wetland type class maps to quantify wetland dynamics through type change and 2) advance methods to characterize wetland type and hydrology. Mapping efforts used multi-seasonal moderate resolution optical and synthetic aperture radar (SAR) imagery sourced from aerial and satellite sensors, ground-truthed field data, and calculated topographic and hydrologic indices to differential between land cover types. Time series Sentinel-1 in Google Earth Engine was used to create maps of seasonal hydroperiod, or inundation dynamics, utilizing cross polarized data. Inundation products from across the spring to fall ice-free season were accumulated to create hydroperiod maps. Due to the diverse ecosystems and diverse hydrologic conditions in boreal wetland ecosystems, these wetlands are some of the most difficult landscapes to accurately map. Additionally, the boreal north is experiencing rapid change as the region warms which can have significant effects on waterfowl populations. Therefore, developing robust methods to monitor wetlands for these regions through SAR’s unique capabilities provides an important resource for waterfowl modeling and habitat vulnerability assessments.
Mapping Arctic-boreal Wildfires using Convolutional Neural Networks (Brendan Rogers)
Theme: Fire Disturbance (Mon 17:00 - 18:00)
- Poster #
13
Stefano Potter (1), Arden Burrell (1), Anna Talucci (1), Yili Yang (2), Logan Berner (3), Scott Goetz (3), James Randerson (4), Sander Veraverbeke (5), Brendan Rogers (1)
Woodwell Climate Research Center (1), Woodwell climate research center (2), Northern Arizona University (3), University Of California, Irvine (4), Vrije Universiteit Amsterdam (5)
Fire is a dominant disturbance in arctic and boreal ecosystems, releases large amounts of greenhouse gasses into the atmosphere, and has been increasing with climate change. However, long-term spatial data on burned area across the arctic-boreal zone is available either through global products with known biases and omissions in high latitudes, or through regional and national databases that do not cover the entire domain. It is therefore critically important to track the spatiotemporal changes in burned area using imagery and techniques suited to the fire regime and spectral/seasonal characteristics of the arctic-boreal zone. Historically, wildfires have been mapped using thresholding approaches with spectral indices such as the differenced Normalized Burn Ratio (dNBR) or with pixel-based mapping approaches such as random forests or gradient boosted decision trees. More recently, algorithms which take into account both spectral and spatial information, such as convolutional neural networks (CNN), have performed better. In this work, we trained a Unet ++ CNN using imagery from Landsat 4-8 and Sentinel-2 satellites to identify burned area in Alaska and Canada, using the red, green, blue, near infrared and shortwave infrared channels in addition to the Normalized Difference Vegetation Index (NDVI), the Normalized Differenced Infrared Index (NDII) and dNBR. For a model trained on the Canadian National Burned Area Composite, we achieved a model accuracy as measured by Intersection Over Union Score of 0.90 within Canada and 0.89 within Alaska, a region for which the model saw no training data. This research represents a crucial first step in our goal to accurately and consistently map burned area at high spatial resolution across the arctic-boreal zone.
Fire is a dominant disturbance in arctic and boreal ecosystems, releases large amounts of greenhouse gasses into the atmosphere, and has been increasing with climate change. However, long-term spatial data on burned area across the arctic-boreal zone is available either through global products with known biases and omissions in high latitudes, or through regional and national databases that do not cover the entire domain. It is therefore critically important to track the spatiotemporal changes in burned area using imagery and techniques suited to the fire regime and spectral/seasonal characteristics of the arctic-boreal zone. Historically, wildfires have been mapped using thresholding approaches with spectral indices such as the differenced Normalized Burn Ratio (dNBR) or with pixel-based mapping approaches such as random forests or gradient boosted decision trees. More recently, algorithms which take into account both spectral and spatial information, such as convolutional neural networks (CNN), have performed better. In this work, we trained a Unet ++ CNN using imagery from Landsat 4-8 and Sentinel-2 satellites to identify burned area in Alaska and Canada, using the red, green, blue, near infrared and shortwave infrared channels in addition to the Normalized Difference Vegetation Index (NDVI), the Normalized Differenced Infrared Index (NDII) and dNBR. For a model trained on the Canadian National Burned Area Composite, we achieved a model accuracy as measured by Intersection Over Union Score of 0.90 within Canada and 0.89 within Alaska, a region for which the model saw no training data. This research represents a crucial first step in our goal to accurately and consistently map burned area at high spatial resolution across the arctic-boreal zone.
Integrated Climate Radiative Forcing from Arctic-boreal fires (Max van Gerrevink)
Theme: Fire Disturbance (Mon 17:00 - 18:00)
- Poster #
15

Max van Gerrevink (1), Sander Veraverbeke (1), Sol Cooperdock (2), Stefano Potter (2), Qirui Zhong (1), Michael Moubarak (3), Scott Goetz (4), Michelle Mack (4), James Randerson (5), Nick Schutgens (1), Merritt Turetsky (6), Guido van der Werf (7), Brendan Rogers (2)
Vrije Universiteit Amsterdam (1), Woodwell Climate Research Center (2), Hamilton College (3), Northern Arizona University (4), University Of California, Irvine (5), University Of Colorado, Boulder (6), Vrije Universiteit (7)
Fire is a major disturbance mechanism in arctic-boreal ecosystems and results in warming and cooling feedbacks to the climate system. Greenhouse gas emissions from fires are a major positive feedback, yet post-fire carbon sequestration in recovering ecosystems partially offsets this. In addition, fire removes part of the organic soil layer and can result in thawing of the permafrost and consequent greenhouse gas emissions. Yet, fire-induced changes in ecosystem structures result in a larger spring-time snow cover compared to unburned areas, and this imposes a negative climate feedback through increased surface albedo. These various climate forcings are spatially and temporally heterogeneous and depend on various landscape components and fire regime characteristics. Understanding the net effect of climate change is crucial to managing and mitigating the impacts of climate change on carbon cycling. We applied the concept of radiative forcing in a quantitative spatial assessment of the net climate feedbacks induced by arctic-boreal North American fires. In our analyses we incorporated all fires between 2001 and 2019, evaluating the net fire-induced forcing over the regrowth successional phase (at 20-years after fire) and after full succession (at 70-years after fire). Our results highlight the spatial and temporal heterogeneity in climate forcings from arctic-boreal fires, and in future work we plan to characterize spatiotemporal patterns of the net climate feedback.
Fire is a major disturbance mechanism in arctic-boreal ecosystems and results in warming and cooling feedbacks to the climate system. Greenhouse gas emissions from fires are a major positive feedback, yet post-fire carbon sequestration in recovering ecosystems partially offsets this. In addition, fire removes part of the organic soil layer and can result in thawing of the permafrost and consequent greenhouse gas emissions. Yet, fire-induced changes in ecosystem structures result in a larger spring-time snow cover compared to unburned areas, and this imposes a negative climate feedback through increased surface albedo. These various climate forcings are spatially and temporally heterogeneous and depend on various landscape components and fire regime characteristics. Understanding the net effect of climate change is crucial to managing and mitigating the impacts of climate change on carbon cycling. We applied the concept of radiative forcing in a quantitative spatial assessment of the net climate feedbacks induced by arctic-boreal North American fires. In our analyses we incorporated all fires between 2001 and 2019, evaluating the net fire-induced forcing over the regrowth successional phase (at 20-years after fire) and after full succession (at 70-years after fire). Our results highlight the spatial and temporal heterogeneity in climate forcings from arctic-boreal fires, and in future work we plan to characterize spatiotemporal patterns of the net climate feedback.
Constructing a Database to Support the Study of ABoVE-domain Tundra Fire Dynamics (Seamore Zhu)
Theme: Fire Disturbance (Mon 17:00 - 18:00)
- Poster #
17
Seamore Zhu (1), Elizabeth Hoy (2), Dong Chen (3), Maruko Kogure (3)
Boston University (1), NASA GSFC / Global Science and Technology, Inc. (2), University of Maryland (3)
Wildfires are rapidly becoming more prevalent in the tundra region, yet there is limited research on tundra fires due to the relative infrequency of these fires in the past and difficult access to remote Arctic sites. As a result, there are many gaps in knowledge of how fires impact tundra soil and vegetation. The NASA Arctic-Boreal Vulnerability Experiment (ABoVE) Fire Disturbance Working Group has undertaken a synthesis project to make analysis of tundra fires in the ABoVE domain more accessible for future researchers. This synthesis study compiled existing datasets of in-situ data from the tundra region of the ABoVE domain. These datasets were pooled from online databases, publications, and correspondence with principal investigators, and reflect work from a wide array of projects and funding sources including ABoVE, Long Term Ecological Research (LTER) archives, and the International Arctic Research Center (IARC). A total of 43 datasets and 196,597 unique data points from 1966 to 2020 were compiled. Forty-one variables reflecting common and important environmental measurements are reflected in this data. A GIS-based analysis was conducted to determine the fire history of each site while remote sensing data across the region were used to determine fire severity at burned sites. This database is the first data collection effort that attempts to aggregate data on multiple environmental, soil, and vegetation variables across the ABoVE tundra region. Future research into tundra fires and their impacts on this region will be able to include this database as a resource to investigate the dynamics between fire and various land attributes.
Wildfires are rapidly becoming more prevalent in the tundra region, yet there is limited research on tundra fires due to the relative infrequency of these fires in the past and difficult access to remote Arctic sites. As a result, there are many gaps in knowledge of how fires impact tundra soil and vegetation. The NASA Arctic-Boreal Vulnerability Experiment (ABoVE) Fire Disturbance Working Group has undertaken a synthesis project to make analysis of tundra fires in the ABoVE domain more accessible for future researchers. This synthesis study compiled existing datasets of in-situ data from the tundra region of the ABoVE domain. These datasets were pooled from online databases, publications, and correspondence with principal investigators, and reflect work from a wide array of projects and funding sources including ABoVE, Long Term Ecological Research (LTER) archives, and the International Arctic Research Center (IARC). A total of 43 datasets and 196,597 unique data points from 1966 to 2020 were compiled. Forty-one variables reflecting common and important environmental measurements are reflected in this data. A GIS-based analysis was conducted to determine the fire history of each site while remote sensing data across the region were used to determine fire severity at burned sites. This database is the first data collection effort that attempts to aggregate data on multiple environmental, soil, and vegetation variables across the ABoVE tundra region. Future research into tundra fires and their impacts on this region will be able to include this database as a resource to investigate the dynamics between fire and various land attributes.
Impact of Fire-Driven Forest Compositional Shifts on Evapotranspiration in Boreal North America (Tyler Albrethsen)
Theme: Fire Disturbance (Mon 17:00 - 18:00)
- Poster #
18
Tyler Albrethsen (1), John Kimball (1), Arthur Endsley (1)
University of Montana (1)
Wildfires are becoming more severe and frequent in North American boreal ecosystems, causing forest compositional shifts in black spruce-dominated landscapes. Between 1989 and 2014, approximately 38% of black spruce forests in North America affected by wildfire experienced compositional shifts to either jack pine or broadleaf dominated stands or failed to regenerate at all. These changes in vegetative composition have large implications for the hydrological regime, particularly for evapotranspiration (ET) which is the primary link between the terrestrial water and energy cycles. Climate projections indicate an intensification of the water cycle at higher latitudes, including an increase in ET. However, the trend is less clear in boreal landscapes due to large landscape heterogeneity. The complex effects of fire disturbance on forest composition represent a major potential factor in variations in ET trends across boreal systems. This proposed research aims to measure changes in ET across different fire severity regimes and assess the effects of fire-driven forest compositional shifts in boreal North America on actual ET. A driving premise of this study is that fire-caused compositional shifts from needleleaf to broadleaf dominated forests experience an increase in ET after recovery relative to unburned areas. To assess the effects of burn severity and vegetation shifts on ET, a Landsat-derived burn severity index will be applied to historical fire perimeters and upscaled to a coarser (500m) grid consistent with a long-term global satellite ET record. The ET estimates from MOD16 will be clipped to fire perimeters and compared to corresponding fire severity levels. ET estimates will also be taken at point locations of in situ post-fire regeneration data to understand how changes in ET relate to forest compositional shifts. With a better understanding of the link between fire severity and ET, estimates of trends in the water and energy cycles can be refined.
Wildfires are becoming more severe and frequent in North American boreal ecosystems, causing forest compositional shifts in black spruce-dominated landscapes. Between 1989 and 2014, approximately 38% of black spruce forests in North America affected by wildfire experienced compositional shifts to either jack pine or broadleaf dominated stands or failed to regenerate at all. These changes in vegetative composition have large implications for the hydrological regime, particularly for evapotranspiration (ET) which is the primary link between the terrestrial water and energy cycles. Climate projections indicate an intensification of the water cycle at higher latitudes, including an increase in ET. However, the trend is less clear in boreal landscapes due to large landscape heterogeneity. The complex effects of fire disturbance on forest composition represent a major potential factor in variations in ET trends across boreal systems. This proposed research aims to measure changes in ET across different fire severity regimes and assess the effects of fire-driven forest compositional shifts in boreal North America on actual ET. A driving premise of this study is that fire-caused compositional shifts from needleleaf to broadleaf dominated forests experience an increase in ET after recovery relative to unburned areas. To assess the effects of burn severity and vegetation shifts on ET, a Landsat-derived burn severity index will be applied to historical fire perimeters and upscaled to a coarser (500m) grid consistent with a long-term global satellite ET record. The ET estimates from MOD16 will be clipped to fire perimeters and compared to corresponding fire severity levels. ET estimates will also be taken at point locations of in situ post-fire regeneration data to understand how changes in ET relate to forest compositional shifts. With a better understanding of the link between fire severity and ET, estimates of trends in the water and energy cycles can be refined.
Permafrost Pathways: Connecting Science, People, and Policy for Arctic Justice and Global Climate (Brendan Rogers)
Theme: Permafrost and Hydrology (Tue 17:00 - 18:00)
- Poster #
14
Brendan Rogers (1), Susan Natali (1), John Holdren (2), Robin Bronen (3), Patricia Cochran (4), Helene Genet (5), Elchin Jafarov (1), Jennifer Watts (1), Rachael Treharne (1), Kyle Arndt (1), Anna-Maria Virkkala (1), Yili Yang (1), Melissa Shapiro (1), Brooke Woods (1), Greg Fiske (1), Trevor Smith (1), Stefano Potter (1), Patrick Murphy (1), Jacqueline Hung (1), Joshua Rady (1), Heidi Rodenhizer (1), Valeria Briones (1), Tiffany Windholz (1), Marco Montemayor (1), Jessica Howard (1)
Woodwell Climate Research Center (1), Harvard University (2), Alaska Institute for Justice (3), Alaska Native Science Commission (4), Institute of Arctic Biology (5)
The arctic and boreal regions are warming at more than twice the global rate, with temperatures already greater than 2°C above preindustrial levels. Rapid warming is intensifying wildfires and thawing permafrost, both of which are transforming northern ecosystems and creating hazardous conditions that are forcing arctic communities to make difficult and urgent adaptation decisions. These changes can also impact global climate through carbon feedbacks, and thus there is an urgent need to reduce the uncertainties that observational and modeling gaps create in understanding the current and future state of permafrost feedbacks. Despite this need, at present, not even current scientific understanding of future emissions from a warming Arctic is reflected in most climate policy planning. Here we present our strategy to address these issues through a six-year science and policy project, Permafrost Pathways. Our scientific approach includes coordinating and expanding the network of CO2 and CH4 eddy covariance sites across the permafrost zone, remote sensing of landscape disturbances, and developing a data assimilation ecosystem model to project carbon-climate feedbacks under various policy scenarios. We work in partnership with local leaders and national policymakers to harness these data to support Arctic community adaptation and appropriate climate mitigation policy. We are also working closely with members of the ABoVE community and contribute to ABoVE objectives regarding permafrost thaw, carbon cycling, disturbances, hydrology, modeling, climate feedbacks, knowledge co-production, and mitigation and adaptation solutions.
The arctic and boreal regions are warming at more than twice the global rate, with temperatures already greater than 2°C above preindustrial levels. Rapid warming is intensifying wildfires and thawing permafrost, both of which are transforming northern ecosystems and creating hazardous conditions that are forcing arctic communities to make difficult and urgent adaptation decisions. These changes can also impact global climate through carbon feedbacks, and thus there is an urgent need to reduce the uncertainties that observational and modeling gaps create in understanding the current and future state of permafrost feedbacks. Despite this need, at present, not even current scientific understanding of future emissions from a warming Arctic is reflected in most climate policy planning. Here we present our strategy to address these issues through a six-year science and policy project, Permafrost Pathways. Our scientific approach includes coordinating and expanding the network of CO2 and CH4 eddy covariance sites across the permafrost zone, remote sensing of landscape disturbances, and developing a data assimilation ecosystem model to project carbon-climate feedbacks under various policy scenarios. We work in partnership with local leaders and national policymakers to harness these data to support Arctic community adaptation and appropriate climate mitigation policy. We are also working closely with members of the ABoVE community and contribute to ABoVE objectives regarding permafrost thaw, carbon cycling, disturbances, hydrology, modeling, climate feedbacks, knowledge co-production, and mitigation and adaptation solutions.
Satellite mapping of land surface freeze-thaw and river beak-up events at local scales over Alaska (Jinyang Du)
Theme: Permafrost and Hydrology (Tue 17:00 - 18:00)
- Poster #
16
Jinyang Du (1), John Kimball (1), Mahta Moghaddam (2), Peter Kirchner (3), Thomas Douglas (4)
University of Montana (1), University of Southern California (2), National Park Service (3), US Army Corps of Engineers, Cold Regions Research and Engineering Laboratory (4)
Accelerated warming in the northern high latitudes is promoting earlier seasonal thaw and springtime river ice breakups. However, complex freeze-thaw (FT) distribution patterns at local scales (1-100m) driven by variations in terrain and microclimate, snow and soil conditions, vegetation cover and disturbance are generally not well-captured by available satellite sensors. The changes in high-latitude vegetation, soil, and rivers have strong implications for water resources, flood and drought cycles, wildlife habitats, aquatic invasive species risk, and human welfare, but they are poorly quantified, partially due to constraints imposed by the coarse resolution of most current and planned global satellite missions that target surface water monitoring. To understand local-scale environmental changes over the high latitudes, we developed probabilistic land surface FT maps for Alaska using a machine-learning approach and an existing binary FT dataset generated from ALOS PALSAR observations acquired during April 2007. Predictors included terrain information derived from USGS 3D Elevation Program (3DEP; 10m resolution) data, MODIS land surface temperature (LST; 8-day composite, 1000-m resolution; MOD11A2), MODIS snow cover (daily sampling, 500-m resolution; MOD10A1), Landsat8 Normalized Difference Vegetation Index (NDVI; 8-day composite, 30-m resolution) and aboveground biomass (for the year 2010; 300-m resolution). The FT predictions showed an overall 92% consistency and reproduced the local-scale FT patterns captured by PALSAR across Alaska. Besides FT mapping for land, Planet Skysat videos were used for tracking a variety of ice objects automatically and generating 2-D river flow velocity maps at sub-meter resolution for the Kobuk River near Kiana, and the Yukon River near Eagle, AK. The satellite flow speed estimates showed a similar magnitude with ground-based measurements (mean difference of ~0.2 m/s). The machine-learning approach and advances in satellite remote sensing allow for improved quantification of the heterogeneity of land/water conditions, supporting assessments of permafrost thaw and thermokarst activity, greenhouse gas emissions, wildfire disturbance, and vegetation recovery at local to landscape scales with the improved temporal record.
Accelerated warming in the northern high latitudes is promoting earlier seasonal thaw and springtime river ice breakups. However, complex freeze-thaw (FT) distribution patterns at local scales (1-100m) driven by variations in terrain and microclimate, snow and soil conditions, vegetation cover and disturbance are generally not well-captured by available satellite sensors. The changes in high-latitude vegetation, soil, and rivers have strong implications for water resources, flood and drought cycles, wildlife habitats, aquatic invasive species risk, and human welfare, but they are poorly quantified, partially due to constraints imposed by the coarse resolution of most current and planned global satellite missions that target surface water monitoring. To understand local-scale environmental changes over the high latitudes, we developed probabilistic land surface FT maps for Alaska using a machine-learning approach and an existing binary FT dataset generated from ALOS PALSAR observations acquired during April 2007. Predictors included terrain information derived from USGS 3D Elevation Program (3DEP; 10m resolution) data, MODIS land surface temperature (LST; 8-day composite, 1000-m resolution; MOD11A2), MODIS snow cover (daily sampling, 500-m resolution; MOD10A1), Landsat8 Normalized Difference Vegetation Index (NDVI; 8-day composite, 30-m resolution) and aboveground biomass (for the year 2010; 300-m resolution). The FT predictions showed an overall 92% consistency and reproduced the local-scale FT patterns captured by PALSAR across Alaska. Besides FT mapping for land, Planet Skysat videos were used for tracking a variety of ice objects automatically and generating 2-D river flow velocity maps at sub-meter resolution for the Kobuk River near Kiana, and the Yukon River near Eagle, AK. The satellite flow speed estimates showed a similar magnitude with ground-based measurements (mean difference of ~0.2 m/s). The machine-learning approach and advances in satellite remote sensing allow for improved quantification of the heterogeneity of land/water conditions, supporting assessments of permafrost thaw and thermokarst activity, greenhouse gas emissions, wildfire disturbance, and vegetation recovery at local to landscape scales with the improved temporal record.
Next-Generation Low-Frequency UWB UAS-Based Software Defined Radar to Acquire Deeper Insights into the Permafrost Subsurface Processes (Kazem Bakian-Dogaheh)
Theme: Permafrost and Hydrology (Tue 17:00 - 18:00)
- Poster #
19
Kazem Bakian-Dogaheh (1), Sepehr Eskandari (1), Piril Nergis (1), Yuhuan Zhao (1), Jinyang Du (2), John Kimball (2), Mahta Moghaddam (1)
University of Southern California (1), University of Montana (2)
Microwave remote sensing, particularly P-band polarimetric SAR foundational flights of the ABoVE Airborne Campaign (AAC), has provided a unique opportunity to study the subsurface processes in the permafrost landscape. AAC flew AirMOSS instrument in 2014, 2015, and 2017 over tens of flight swaths across a gradient of bioclimatic zones. The acquired radar backscattering coefficient through AAC was initially adapted into physics-based radar retrieval algorithms to achieve active layer thaw depth maps over the “legacy” flight lines. In the past few years, efforts have been focused on advancing physics-based retrieval algorithms by linking field scale observations and radar models to estimate soil moisture and soil organic matter profiles of the permafrost active layer. While these efforts in turn would result in first airborne-driven soil organic carbon map, the lack of further P-band flights and particularly the overwhelming cost of operating such a system prevent deeper understanding of the permafrost subsurface processes. This poster, we report on a new state-of-the-art Uncrewed Aircraft System (UAS) based software-defined radar (SDRadar). This sensor is equipped with an in-house developed ultrawideband (UWB) full polarimetric antenna, which enables a bandwidth between 250-2000 MHz. The new system is developed based on the Xilinx Radio-Frequency System-on-Chip (RFSoC) platform and a custom-developed IP core that can synthesize an ultrawideband waveform on multiple channels for the purpose of collecting polarimetric data. Different modes of operation, including sounding and polarimetric imaging capabilities, provide an unprecedented diversity of observations for studying the surface and subsurface properties in permafrost landscapes, deeper and with high resolutions for forested and non-forested areas. This poster will present technical highlights of this UAS-based SDRadar, along with a preliminary experiment plan for the upcoming ABoVE Phase III field campaigns in the summer of 2023.
Microwave remote sensing, particularly P-band polarimetric SAR foundational flights of the ABoVE Airborne Campaign (AAC), has provided a unique opportunity to study the subsurface processes in the permafrost landscape. AAC flew AirMOSS instrument in 2014, 2015, and 2017 over tens of flight swaths across a gradient of bioclimatic zones. The acquired radar backscattering coefficient through AAC was initially adapted into physics-based radar retrieval algorithms to achieve active layer thaw depth maps over the “legacy” flight lines. In the past few years, efforts have been focused on advancing physics-based retrieval algorithms by linking field scale observations and radar models to estimate soil moisture and soil organic matter profiles of the permafrost active layer. While these efforts in turn would result in first airborne-driven soil organic carbon map, the lack of further P-band flights and particularly the overwhelming cost of operating such a system prevent deeper understanding of the permafrost subsurface processes. This poster, we report on a new state-of-the-art Uncrewed Aircraft System (UAS) based software-defined radar (SDRadar). This sensor is equipped with an in-house developed ultrawideband (UWB) full polarimetric antenna, which enables a bandwidth between 250-2000 MHz. The new system is developed based on the Xilinx Radio-Frequency System-on-Chip (RFSoC) platform and a custom-developed IP core that can synthesize an ultrawideband waveform on multiple channels for the purpose of collecting polarimetric data. Different modes of operation, including sounding and polarimetric imaging capabilities, provide an unprecedented diversity of observations for studying the surface and subsurface properties in permafrost landscapes, deeper and with high resolutions for forested and non-forested areas. This poster will present technical highlights of this UAS-based SDRadar, along with a preliminary experiment plan for the upcoming ABoVE Phase III field campaigns in the summer of 2023.
Retrieving Soil Organic Matter and Soil Moisture Profiles over the Arctic Foothills Tundra, using P-band Polarimetric SAR imagery (Kazem Bakian-Dogaheh)
Theme: Permafrost and Hydrology (Tue 17:00 - 18:00)
- Poster #
20
Kazem Bakian-Dogaheh (1), Yuhuan Zhao (1), John Kimball (2), Mahta Moghaddam (1)
University of Southern California (1), University of Montana (2)
Improving the regional mapping of organic soil properties by synthesizing the wealth of ABoVE field and Airborne science data is key in unraveling the water and carbon cycle dynamics in permafrost soils and their influence on climate-driven vulnerabilities of the Arctic. More specifically, low-frequency (P-band) polarimetric Synthetic Aperture Radar (SAR) data acquired from foundational flights during the ABoVE Airborne Campaigns provide a unique opportunity to study the water and carbon characteristics of the permafrost active layer across critical Arctic ecosystems, environmental gradients, and bioclimatic zones. Here, we summarize efforts in building a physics-based radar modeling framework that enables joint retrievals of the tundra active layer soil organic matter content and soil moisture profile using P-band polarimetric SAR. Our framework consists of 3 sub-modules, where initially an extensive field observation enables modeling of the subsurface soil moisture and organic matter profiles with independent model parameters that represent, in part, organic layer thickness, water table depth, and thaw depth. In the second module, a new organic soil dielectric model translates the soil profile properties into equivalent dielectric properties, which is a critical step in the framework that quantifies physical linkages between soil field properties and radar measurements. Finally, in the third module, the multi-layered dielectric structure is adopted by an Electromagnetic scattering computational model that predicts equivalent backscattering coefficients resulting from the soil profile state parameters. These pieces together construct the “Forward” model, which is at the heart of a physics-based radar retrieval algorithm. This presentation further integrates the developed Forward model into a retrieval scheme, in which the soil moisture and soil organic profile model parameters are estimated using the radar backscattering coefficient measured by AirMOSS. We show retrieved soil moisture and soil organic matter profiles, derived pixel-wise by the algorithm. This algorithm is being applied to all the flight swaths in the Arctic Foothills tundra region and provides a significant advance over current baseline retrieval by providing first airborne-driven soil organic carbon map.
Improving the regional mapping of organic soil properties by synthesizing the wealth of ABoVE field and Airborne science data is key in unraveling the water and carbon cycle dynamics in permafrost soils and their influence on climate-driven vulnerabilities of the Arctic. More specifically, low-frequency (P-band) polarimetric Synthetic Aperture Radar (SAR) data acquired from foundational flights during the ABoVE Airborne Campaigns provide a unique opportunity to study the water and carbon characteristics of the permafrost active layer across critical Arctic ecosystems, environmental gradients, and bioclimatic zones. Here, we summarize efforts in building a physics-based radar modeling framework that enables joint retrievals of the tundra active layer soil organic matter content and soil moisture profile using P-band polarimetric SAR. Our framework consists of 3 sub-modules, where initially an extensive field observation enables modeling of the subsurface soil moisture and organic matter profiles with independent model parameters that represent, in part, organic layer thickness, water table depth, and thaw depth. In the second module, a new organic soil dielectric model translates the soil profile properties into equivalent dielectric properties, which is a critical step in the framework that quantifies physical linkages between soil field properties and radar measurements. Finally, in the third module, the multi-layered dielectric structure is adopted by an Electromagnetic scattering computational model that predicts equivalent backscattering coefficients resulting from the soil profile state parameters. These pieces together construct the “Forward” model, which is at the heart of a physics-based radar retrieval algorithm. This presentation further integrates the developed Forward model into a retrieval scheme, in which the soil moisture and soil organic profile model parameters are estimated using the radar backscattering coefficient measured by AirMOSS. We show retrieved soil moisture and soil organic matter profiles, derived pixel-wise by the algorithm. This algorithm is being applied to all the flight swaths in the Arctic Foothills tundra region and provides a significant advance over current baseline retrieval by providing first airborne-driven soil organic carbon map.
An improved plant hydraulics model for Earth System Models (Anna Gagné-Landmann)
Theme: Permafrost and Hydrology (Tue 17:00 - 18:00)
- Poster #
22
Anna Gagné-Landmann (1), Polina Khapikova (2), Yujie Wang (2), Pierre-Olivier Parisé (3), Renato Braghiere (2), Valeria Barra (2), Anthony Bloom (4), John Worden (4), Christian Frankenberg (2), Pierre Gentine (5), Tapio Schneider (2), Katherine Deck (2)
Woodwell (1), Caltech (2), University of Hawai'i at Manoa (3), JPL (4), Columbia (5)
We present the governing equations of the new plant hydraulics component of the land model of the Climate Modeling Alliance (CliMA) Earth System Model, and test results. Current plant hydraulic models used to model water fluxes and water content at the single tree scale and at the grid-scale for land modeling and ESM purposes present limitations (eg. their steady-state assumption). We rederived the equations for representing water fluxes and water content as a function of time and position from Darcy's law, demonstrating where the equations come from, and presented solutions to each of the current limitations. The features of this model include its 1) non-steady-state assumption, 2) representation of gravitational potential, 3) representation of water along the flow path instead of as a function of height, 4) use of a state variable which allows for the expansion of water-holding capacity beyond porosity, 5) ability to extract water at different soil depths, 6) low-complexity (few parameters), 7) modularity (can increase the resolution of the tree from 2 compartments to n compartments), and 8) its ability to model fluxes in the positive and negative directions. Although most of these fixes were introduced separately in other works, we combine them for an expected overall improved performance. We tested the model in coupled mode with the CliMA soil model at a test site in Ozark, Missouri, with prescribed transpiration and precipitation, using meteorological data from the AmeriFlux Missouri Ozark site. We present modeled soil water content and leaf water potential as a function of position in the flow path and time against measurements of these two variables. Future work includes coupling this plant hydraulics model to a transpiration scheme, and comparing transpiration fluxes from the CliMA land model to those modeled by other land models.
We present the governing equations of the new plant hydraulics component of the land model of the Climate Modeling Alliance (CliMA) Earth System Model, and test results. Current plant hydraulic models used to model water fluxes and water content at the single tree scale and at the grid-scale for land modeling and ESM purposes present limitations (eg. their steady-state assumption). We rederived the equations for representing water fluxes and water content as a function of time and position from Darcy's law, demonstrating where the equations come from, and presented solutions to each of the current limitations. The features of this model include its 1) non-steady-state assumption, 2) representation of gravitational potential, 3) representation of water along the flow path instead of as a function of height, 4) use of a state variable which allows for the expansion of water-holding capacity beyond porosity, 5) ability to extract water at different soil depths, 6) low-complexity (few parameters), 7) modularity (can increase the resolution of the tree from 2 compartments to n compartments), and 8) its ability to model fluxes in the positive and negative directions. Although most of these fixes were introduced separately in other works, we combine them for an expected overall improved performance. We tested the model in coupled mode with the CliMA soil model at a test site in Ozark, Missouri, with prescribed transpiration and precipitation, using meteorological data from the AmeriFlux Missouri Ozark site. We present modeled soil water content and leaf water potential as a function of position in the flow path and time against measurements of these two variables. Future work includes coupling this plant hydraulics model to a transpiration scheme, and comparing transpiration fluxes from the CliMA land model to those modeled by other land models.
Quantifying Permafrost Carbon Dynamics with Feedback Neural Networks and Ecological Memory (Bradley Gay)
Theme: Permafrost and Hydrology (Tue 17:00 - 18:00)
- Poster #
24
Bradley Gay (1), Andreas Züfle (2), Amanda Armstrong (3), Qu John (4), Neal Pastick (5)
George Mason University, NASA ABoVE (1), Emory University (2), NASA GSFC / USRA GESTAR (3), George Mason University (4), USGS / EROS (5)
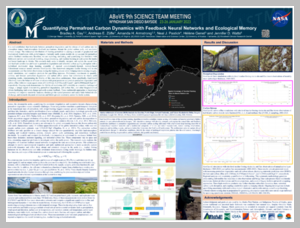
It is well-established that positive feedbacks between permafrost degradation and the release of soil carbon into the atmosphere impact land atmosphere feedback mechanisms, disrupt the global carbon cycle, and accelerate climate change. Permafrost dynamics are relevant to the global community because the distribution of this frozen ground substrate characterizes nearly 23 million square kilometers of the northern latitudes. The widespread distribution of thawing permafrost is causing a cascade of geophysical and biochemical disturbances with global impacts. Current earth system models do not account for permafrost carbon feedback mechanisms; we are exploring, simulating, and quantifying this limitation with field-scale surveys and numerical modeling, image processing, and machine learning at scale across the tundra taiga ecotone (TTE). This research seeks to identify, interpret, and explain the causal links and feedback sensitivities attributed to permafrost degradation and terrestrial carbon cycling asymmetry with in situ measurements, flux tower observations, remote sensing imagery, modeling and reanalysis products, and a hybridized multimodal deep learning ensemble of stacked recurrent-layered, memory-based networks (GeoCryoAI). Preliminary metrics obtained from mirroring freeze-thaw dynamics (cm) and methane efflux (?molCH4mol-1m) across four subdomains in Alaska yield a root mean square error of 6.3637 and 4.7973, respectively. Ongoing work demonstrates the fidelity of monitoring active layer thickness (ALT) variability as a sensitive harbinger of change, a unique signal characterizing permafrost degradation, soil carbon flux, and other biogeochemical drivers facilitating land cover change and earth system feedback. These multimodal approaches to knowledge discovery will improve sensitivity analyses, disentangle the spatial processes and causal links behind drivers of change, and reconcile disparate estimations and below-ground uncertainty across the Arctic system.
It is well-established that positive feedbacks between permafrost degradation and the release of soil carbon into the atmosphere impact land atmosphere feedback mechanisms, disrupt the global carbon cycle, and accelerate climate change. Permafrost dynamics are relevant to the global community because the distribution of this frozen ground substrate characterizes nearly 23 million square kilometers of the northern latitudes. The widespread distribution of thawing permafrost is causing a cascade of geophysical and biochemical disturbances with global impacts. Current earth system models do not account for permafrost carbon feedback mechanisms; we are exploring, simulating, and quantifying this limitation with field-scale surveys and numerical modeling, image processing, and machine learning at scale across the tundra taiga ecotone (TTE). This research seeks to identify, interpret, and explain the causal links and feedback sensitivities attributed to permafrost degradation and terrestrial carbon cycling asymmetry with in situ measurements, flux tower observations, remote sensing imagery, modeling and reanalysis products, and a hybridized multimodal deep learning ensemble of stacked recurrent-layered, memory-based networks (GeoCryoAI). Preliminary metrics obtained from mirroring freeze-thaw dynamics (cm) and methane efflux (?molCH4mol-1m) across four subdomains in Alaska yield a root mean square error of 6.3637 and 4.7973, respectively. Ongoing work demonstrates the fidelity of monitoring active layer thickness (ALT) variability as a sensitive harbinger of change, a unique signal characterizing permafrost degradation, soil carbon flux, and other biogeochemical drivers facilitating land cover change and earth system feedback. These multimodal approaches to knowledge discovery will improve sensitivity analyses, disentangle the spatial processes and causal links behind drivers of change, and reconcile disparate estimations and below-ground uncertainty across the Arctic system.
Using High-resolution Satellite Imagery and Deep Learning to Track Dynamic Seasonality in Small Water Bodies (Andrew Mullen)
Theme: Permafrost and Hydrology (Tue 17:00 - 18:00)
- Poster #
26
Andrew Mullen (1), Jennifer Watts (1), Brendan Rogers (1), Mark Carroll (2), Clayton Elder (3), Jonas Noomah (1), Zachary Williams (2), Jordan Caraballo-Vega (2), Allison Bredder (4), Eliza Rickenbaugh (5), Eric Levenson (6), Sarah Cooley (6), Jacqueline Hung (1), Greg Fiske (1), Stefano Potter (1), Yili Yang (1), Charles Miller (7), Susan Natali (1), Thomas Douglass (8), Ethan Kyzivat (9)
Woodwell Climate Research Center (1), NASA GSFC (2), Jet Propulsion Laboratory (3), University of Maryland (4), Montana State University (5), University of Oregon (6), NASA JPL (7), U.S. Army Cold Regions Research and Engineering Laboratory (8), Brown University (9)
Water bodies are integral components of hydrology and carbon cycling in the Arctic-Boreal domain. Ponds (< 0.01 km2) are highly variable over seasonal to climatological timescales, responding more rapidly to permafrost degradation and changes in hydrological fluxes than larger lakes (> 0.01 km2). Many existing water mapping approaches rely on moderate to coarse-resolution remotely sensed imagery from publicly available platforms (i.e. Sentinel-2, Landsat, and MODIS). These commonly-used remote sensing platforms lack the spatial and temporal resolutions required to detect ponds and track changes in their surface area over an individual season. We used a convolutional neural network (U-Net) for automated lake and pond detection in 3 m optical satellite imagery from Planet Labs’ PlanetScope constellation. We test this method for tracking changes in lake and pond areal extent at daily to weekly frequencies over four study regions in Alaska’s boreal forest and tundra biomes. The detection method achieved high accuracy (F-1 Score: 0.95, IOU Score: 0.91) and has a minimum detectable water body area of 0.0001 km2. Tracking of individual water bodies over the 2021 snow-free season (May – September) revealed total pond surface area varied by 20% – 40%, while total lake areal extent changed by 3% – 10%. We compared the new 3 m PlanetScope-derived water body maps to lake and pond maps from Sentinel-2, Landsat, and MODIS, and determined minimum detectable water body sizes from these coarser-resolution platforms. Comparisons showed the PlanetScope water maps detected 8%, 18%, and 22% more total water body surface area than the Sentinel-2, Landsat, and MODIS-based products respectively. Finally, we provide a use case example for the new PlanetScope lake and pond maps with a regional CH4 upscaling experiment. This research advances the capacity for monitoring very small water features with applications across a variety of hydrological and biogeochemical applications. Future work will leverage high-resolution X-band synthetic-aperture radar imagery from Capella Space to enhance classifications of complex wet landscapes.
Water bodies are integral components of hydrology and carbon cycling in the Arctic-Boreal domain. Ponds (< 0.01 km2) are highly variable over seasonal to climatological timescales, responding more rapidly to permafrost degradation and changes in hydrological fluxes than larger lakes (> 0.01 km2). Many existing water mapping approaches rely on moderate to coarse-resolution remotely sensed imagery from publicly available platforms (i.e. Sentinel-2, Landsat, and MODIS). These commonly-used remote sensing platforms lack the spatial and temporal resolutions required to detect ponds and track changes in their surface area over an individual season. We used a convolutional neural network (U-Net) for automated lake and pond detection in 3 m optical satellite imagery from Planet Labs’ PlanetScope constellation. We test this method for tracking changes in lake and pond areal extent at daily to weekly frequencies over four study regions in Alaska’s boreal forest and tundra biomes. The detection method achieved high accuracy (F-1 Score: 0.95, IOU Score: 0.91) and has a minimum detectable water body area of 0.0001 km2. Tracking of individual water bodies over the 2021 snow-free season (May – September) revealed total pond surface area varied by 20% – 40%, while total lake areal extent changed by 3% – 10%. We compared the new 3 m PlanetScope-derived water body maps to lake and pond maps from Sentinel-2, Landsat, and MODIS, and determined minimum detectable water body sizes from these coarser-resolution platforms. Comparisons showed the PlanetScope water maps detected 8%, 18%, and 22% more total water body surface area than the Sentinel-2, Landsat, and MODIS-based products respectively. Finally, we provide a use case example for the new PlanetScope lake and pond maps with a regional CH4 upscaling experiment. This research advances the capacity for monitoring very small water features with applications across a variety of hydrological and biogeochemical applications. Future work will leverage high-resolution X-band synthetic-aperture radar imagery from Capella Space to enhance classifications of complex wet landscapes.
NDVI and microtopography interactions in ice wedge systems in Utqiagvik, Alaska (Melissa Ward Jones)
Theme: Permafrost and Hydrology (Tue 17:00 - 18:00)
- Poster #
28
Melissa Ward Jones (1), Benjamin Jones (1), Mikhail Kanevskiy (1), Emily Youcha (1)
Institute of Northern Engineering - University of Alaska Fairbanks (1)
Polygonal patterned ground is formed by ice wedges that are common to terrestrial permafrost systems, for examples, covering 60 % of the land surface of the Alaska Arctic Coastal plain. Ice wedge formation and degradation drives micro-topography that influences ecosystem processes such as ground temperatures, vegetation, hydrology, snow distribution and biogeochemical fluxes, however one of the main challenges with understanding these systems is their fine scale presence (roughly few meters) makes detecting them with coarser remote sensing products like Landsat (30 m) inadequate. Recent studies have shown complex greening and browning trends in the Arctic, but typically use coarse remote sensing products like Landsat or MODIS. We present field data collected in ice wedge systems in Utqiagvik, AK in summer 2022. We found a relationship between micro-topography and NDVI using 10 cm multispectral dataset collected using a UAV. This relationship is lost when scaling up to coarser remote sensing products such as 3 m Planet imagery that was collected within a week of field measurements. We discuss how fine scale dynamics NDVI are translated or lost to coarser remote sensing products. Our analysis can aid in interpreting the complexities of observed pan-Arctic NDVI trends.
Polygonal patterned ground is formed by ice wedges that are common to terrestrial permafrost systems, for examples, covering 60 % of the land surface of the Alaska Arctic Coastal plain. Ice wedge formation and degradation drives micro-topography that influences ecosystem processes such as ground temperatures, vegetation, hydrology, snow distribution and biogeochemical fluxes, however one of the main challenges with understanding these systems is their fine scale presence (roughly few meters) makes detecting them with coarser remote sensing products like Landsat (30 m) inadequate. Recent studies have shown complex greening and browning trends in the Arctic, but typically use coarse remote sensing products like Landsat or MODIS. We present field data collected in ice wedge systems in Utqiagvik, AK in summer 2022. We found a relationship between micro-topography and NDVI using 10 cm multispectral dataset collected using a UAV. This relationship is lost when scaling up to coarser remote sensing products such as 3 m Planet imagery that was collected within a week of field measurements. We discuss how fine scale dynamics NDVI are translated or lost to coarser remote sensing products. Our analysis can aid in interpreting the complexities of observed pan-Arctic NDVI trends.
ABoVE In and Around the Northwest Territories (Jacki Moore-Tsetta, Ryan Walsh)
Theme: Permafrost and Hydrology (Tue 17:00 - 18:00)
- Poster #
30

Jacki Moore-Tsetta (1), Ryan Walsh (2)
North Slave Métis Alliance (1), NWT Centre for Geomatics (2)
Personal reflections on the ABoVE project in the Northwest Territories and the role geomatics currently plays in permafrost research: soil core sampling to determine characteristics of permafrost thaw, including moisture, leaf spectra, and thaw depth; remote sensing and aerial photography for long-term change detection. A discussion on how the drastic effects of climate change on permafrost adversely affect life in the North; countermeasures promote climate knowledge among residents. How being introduced to geomatics induced a change in career path for a math student and the knowledge that transfers from that field.
Personal reflections on the ABoVE project in the Northwest Territories and the role geomatics currently plays in permafrost research: soil core sampling to determine characteristics of permafrost thaw, including moisture, leaf spectra, and thaw depth; remote sensing and aerial photography for long-term change detection. A discussion on how the drastic effects of climate change on permafrost adversely affect life in the North; countermeasures promote climate knowledge among residents. How being introduced to geomatics induced a change in career path for a math student and the knowledge that transfers from that field.
LCLUC Impacts of Arctic Oil and Gas Exploration (Avi Martin)
Theme: Permafrost and Hydrology (Tue 17:00 - 18:00)
- Poster #
32
Avi Martin (1), Daniel Sousa (1)
San Diego State University (1)
This literature review seeks to study land cover and land usage change in North Slope Borough (NSB), Alaska and Bovanenkovo gas field in Yamal Peninsula, Russia. More specifically, to find the effects of oil and gas exploration in the areas on permafrost. The results of this review will be used to identify and forecast vulnerabilities of the eight communities in NSB, Alaska due to energy expansion by National Petroleum Reserve-Alaska (NPR-A) and the Alaska National Wildlife Reserve (ANWR). The review will utilize existing frameworks from earlier research on the Yamal Peninsula, Russia. The frameworks will be further developed through analysis of infrastructure development. The more highly inhabited North American Arctic poses different potential scenarios not seen in the Siberian Arctic. This is in response to the United Nations Environment Program call to action to identify those regions most susceptible to the wearing down of permafrost. The analysis will lead to an understanding of methods to reduce the vulnerability of communities impacted by expanding oil and gas infrastructure. Understanding the history of this area is key to determining the environmental effects that human presence has caused. Arctic ecosystems have proven to be sensitive to human actions, as well as infrastructure failures. One such instance was the May 2020 oil spill in Norilsk, Russia, which caused the surrounding water and soil to be contaminated. The review will be researched with the use of San Diego State University’s OneSearch database, the Google Scholar search engine, and similar online tools. The key terms and phrases used to locate relevant articles, leases, and other documents will include “Prudhoe Bay,” “North Slope Borough,” “Northern Alaska,” “NASA LCLUC,” and “oil exploration.” Our findings in this review will help to determine what communities in the region have been greatly affected due to exploration and will serve as the basis of our LCLUC project.
This literature review seeks to study land cover and land usage change in North Slope Borough (NSB), Alaska and Bovanenkovo gas field in Yamal Peninsula, Russia. More specifically, to find the effects of oil and gas exploration in the areas on permafrost. The results of this review will be used to identify and forecast vulnerabilities of the eight communities in NSB, Alaska due to energy expansion by National Petroleum Reserve-Alaska (NPR-A) and the Alaska National Wildlife Reserve (ANWR). The review will utilize existing frameworks from earlier research on the Yamal Peninsula, Russia. The frameworks will be further developed through analysis of infrastructure development. The more highly inhabited North American Arctic poses different potential scenarios not seen in the Siberian Arctic. This is in response to the United Nations Environment Program call to action to identify those regions most susceptible to the wearing down of permafrost. The analysis will lead to an understanding of methods to reduce the vulnerability of communities impacted by expanding oil and gas infrastructure. Understanding the history of this area is key to determining the environmental effects that human presence has caused. Arctic ecosystems have proven to be sensitive to human actions, as well as infrastructure failures. One such instance was the May 2020 oil spill in Norilsk, Russia, which caused the surrounding water and soil to be contaminated. The review will be researched with the use of San Diego State University’s OneSearch database, the Google Scholar search engine, and similar online tools. The key terms and phrases used to locate relevant articles, leases, and other documents will include “Prudhoe Bay,” “North Slope Borough,” “Northern Alaska,” “NASA LCLUC,” and “oil exploration.” Our findings in this review will help to determine what communities in the region have been greatly affected due to exploration and will serve as the basis of our LCLUC project.
Circumboreal Site Index Estimated with Landsat, ICESat-2, and WorldView Stereo Imagery (Christopher Neigh)
Theme: Vegetation Structure and Function (Wed 17:00 - 18:00)
- Poster #
43
Christopher Neigh (1), Paul Montesano (2), Margaret Wooten (3), William Wagner (3), Joe Sexton (4), Min Feng (5), Panshi Wang (4), Saurabh Channan (6), Nuno Carvalhais (7), Benjamin Poulter (1)
NASA GSFC (1), NASA GSFC / ADNET (2), NASA GSFC / SSAI (3), TerraPulse Inc. (4), University of Maryland (5), UMD / GLCF (6), Max Planck Institute for Biogeochemistry (7)
The higher northern latitudes of our planet have been disproportionally impacted by climate warming which has altered the ecophysiology of vegetation in this domain. Site Index (SI) is a parameter widely used in forestry to describe the potential height-growth of trees in a particular location or 'site' at a given age. Spatially explicit knowledge of forest age and SI could reduce live C turnover uncertainty into soil C pools by constraining model estimates of woody C accumulation rates. We have estimated boreal forest SI by pairing Landsat annual estimates of forest age from 1984 through 2020 with the Ice, Cloud and Land Elevation Satellite version 2 (ICESat-2) ATL08 20 [m] vegetation height product and commercial WorldView stereo imagery estimates of forest height. We will present our methods for estimating SI from these data and our mapping results for the entire boreal forest.
The higher northern latitudes of our planet have been disproportionally impacted by climate warming which has altered the ecophysiology of vegetation in this domain. Site Index (SI) is a parameter widely used in forestry to describe the potential height-growth of trees in a particular location or 'site' at a given age. Spatially explicit knowledge of forest age and SI could reduce live C turnover uncertainty into soil C pools by constraining model estimates of woody C accumulation rates. We have estimated boreal forest SI by pairing Landsat annual estimates of forest age from 1984 through 2020 with the Ice, Cloud and Land Elevation Satellite version 2 (ICESat-2) ATL08 20 [m] vegetation height product and commercial WorldView stereo imagery estimates of forest height. We will present our methods for estimating SI from these data and our mapping results for the entire boreal forest.
Foliar functional trait variation in ABoVE Arctic and Boreal regions of North America (Kyle Kovach)
Theme: Vegetation Structure and Function (Wed 17:00 - 18:00)
- Poster #
45
Kyle Kovach (1), Ryan Pavlick (2), Zhiwei Ye (1), Charles Miller (2), Eric Kruger (1), Else Radeloff (1), Adam Redmer (1), Morgan Dean (3), Samuel Jaeger (1), Philip Townsend (1)
University of Wisconsin (1), NASA Jet Propulsion Laboratory (2), NASA Jet Propulsion Labratory (3)
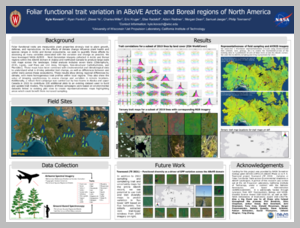
Foliar functional traits are measurable plant properties strongly tied to plant growth, defense, and reproduction. As the effects of climate change influence plant health and species ranges in Arctic and Boreal ecosystems, we seek to quantify these effects by assessing as many variables associated with the variation and change as possible. We have leveraged NASA AVIRIS – Next Generation imagery collected in Arctic and Boreal regions within the ABoVE domain in Alaska and northwest Canada to produce large scale trait maps across the landscape. Initial analysis includes seven traits (Chlorophylls, d13C, Lignin, Leaf Mass per Unit Area, Nitrogen, Non-structural Carbohydrates, and Phenolics). These maps have been combined with environmental and climatological data to understand what is driving potential trait change, as well as differences between and within traits across these ecosystems. These results show strong regional differences by climate, with more homogeneous trait profiles within local regions. They also show the value of imaging spectroscopy to assess change and variation in remote locations. Additionally, a robust field campaign was carried out by two teams in Alaska and upper Canada in 2022 to contribute 205 additional plots to an existing dataset used to build and update trait models. The locations of these campaigns were based on environmental datasets linked to existing plot sites to create representativeness maps highlighting areas which could benefit from increased sampling.
Foliar functional traits are measurable plant properties strongly tied to plant growth, defense, and reproduction. As the effects of climate change influence plant health and species ranges in Arctic and Boreal ecosystems, we seek to quantify these effects by assessing as many variables associated with the variation and change as possible. We have leveraged NASA AVIRIS – Next Generation imagery collected in Arctic and Boreal regions within the ABoVE domain in Alaska and northwest Canada to produce large scale trait maps across the landscape. Initial analysis includes seven traits (Chlorophylls, d13C, Lignin, Leaf Mass per Unit Area, Nitrogen, Non-structural Carbohydrates, and Phenolics). These maps have been combined with environmental and climatological data to understand what is driving potential trait change, as well as differences between and within traits across these ecosystems. These results show strong regional differences by climate, with more homogeneous trait profiles within local regions. They also show the value of imaging spectroscopy to assess change and variation in remote locations. Additionally, a robust field campaign was carried out by two teams in Alaska and upper Canada in 2022 to contribute 205 additional plots to an existing dataset used to build and update trait models. The locations of these campaigns were based on environmental datasets linked to existing plot sites to create representativeness maps highlighting areas which could benefit from increased sampling.
Derivation of inundation metrics derived from UAVSAR L-band imagery within the ABoVE domain. (Bruce Chapman)
Theme: Vegetation Dynamics and Distribution (Wed 17:00 - 18:00)
- Poster #
2
Bruce Chapman (1), Nancy French (2), Michael Battaglia (3), AnneMarie Peacock (1)
JPL (1), Michigan Tech Research Institute (MTRI) (2), Michigan Technological University (3)
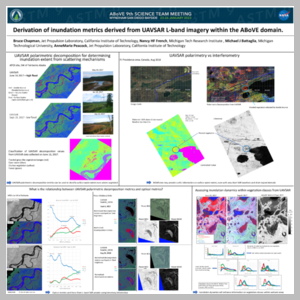
Since 2017, the NASA Arctic-Boreal Vulnerability Experiment (ABoVE) has conducted a series of airborne data acquisitions over wetland areas in Alaska and Canada, including L-band SAR observations by the NASA UAVSAR instrument. In order to evaluate inundation extent for these sites, we have first performed a Yamaguchi 4 component decomposition to estimate the L-band radar scattering mechanisms that occurred while interacting with the ground landscape. When examining the normalized scattering components, inundated vegetation is dominated by double bounce scattering while open water areas are dominated by surface scattering. To differentiate from non-inundated areas, the relative backscattering intensities can be helpful for differentiation. When the NISAR L-band SAR mission launches in 2024, dual pol imagery will be typically collected, and the noise characteristics will differ from those of UAVSAR. Therefore, we have also examined NISAR-like products from UAVSAR in order to investigate the sensitivity of those data sets for monitoring inundation extent. in this poster, example results will be shown for site in Alaska and Canada, and compared against in situ observations as well as other remote sensing results. Scattering signatures as a function of vegetation class identified in the Peace-Athabasca Delta will be shown. A comparison of inundation metrics from Planet Dove imagery with UAVSAR-derived inundation classes will be shown. The work reported here was performed at the Jet Propulsion Laboratory, California Institute of Technology, under contract with the National Aeronautics and Space Administration.
Since 2017, the NASA Arctic-Boreal Vulnerability Experiment (ABoVE) has conducted a series of airborne data acquisitions over wetland areas in Alaska and Canada, including L-band SAR observations by the NASA UAVSAR instrument. In order to evaluate inundation extent for these sites, we have first performed a Yamaguchi 4 component decomposition to estimate the L-band radar scattering mechanisms that occurred while interacting with the ground landscape. When examining the normalized scattering components, inundated vegetation is dominated by double bounce scattering while open water areas are dominated by surface scattering. To differentiate from non-inundated areas, the relative backscattering intensities can be helpful for differentiation. When the NISAR L-band SAR mission launches in 2024, dual pol imagery will be typically collected, and the noise characteristics will differ from those of UAVSAR. Therefore, we have also examined NISAR-like products from UAVSAR in order to investigate the sensitivity of those data sets for monitoring inundation extent. in this poster, example results will be shown for site in Alaska and Canada, and compared against in situ observations as well as other remote sensing results. Scattering signatures as a function of vegetation class identified in the Peace-Athabasca Delta will be shown. A comparison of inundation metrics from Planet Dove imagery with UAVSAR-derived inundation classes will be shown. The work reported here was performed at the Jet Propulsion Laboratory, California Institute of Technology, under contract with the National Aeronautics and Space Administration.
Comparisons of Tree Damage Indicators in Five NASA ABoVE Forest Sites Near Fairbanks, Alaska (Christopher Potter)
Theme: Vegetation Dynamics and Distribution (Wed 17:00 - 18:00)
- Poster #
4
Diane Huebner (1), Christopher Potter (2)
NASA Ames Research Center (1), NASA ARC (2)
As climate warming affects sensitive northern regions, forests near Fairbanks, Alaska may be experiencing tree stress in the form of leaf and stem changes during the growing season caused by drought, pests, and pathogens. Visual surveys of tree canopies and stems are simple, quick, and useful for assessing forest health in remote sensing studies that employ ground truthing. Using indexes of 0-5 (0 = no change, 5 = severe change) based on visual assessments of leaf color and leaf damage, defined as leaf color change, leaf wilting, holes/defoliation/pest and pathogen presence visible over > 50% of the leaf canopy; and stem damage defined as changes in bark color, texture, stem number, or significant sap residue, we analyzed changes associated with tree stress in 262 deciduous and 312 conifer trees from five sites encompassing different elevations, moisture regimes and burn severities imaged by NASA aircraft in 2017-2022 using AVIRIS-NG hyperspectral technology for the Arctic and Boreal Vulnerability Experiment (ABoVE). Our visual surveys from 2021-22 found greater leaf damage and average tree damage (mean of leaf and stem damage) in steeply sloped aspen and birch forest showing average June-August soil moisture < 50%, and average June-August soil temperatures that were 3.8 °C warmer than conifer forest soils. Leaf damage was lightest in unburned conifer forest associated with greater moss cover, soil moisture above 50%, and deeper thaw depths. Across burn severities, leaf damage was greatest in lightly burned open conifer forest with surviving trees, and stem damage was highest in severely burned conifer sites recruited by birch and aspen saplings. Leaf changes were mainly caused by pathogens or insects, while most stem changes were likely caused by browsing mammals. Increasing pest/pathogen loads on mature trees and saplings could affect carbon uptake and forest successional trajectories.
As climate warming affects sensitive northern regions, forests near Fairbanks, Alaska may be experiencing tree stress in the form of leaf and stem changes during the growing season caused by drought, pests, and pathogens. Visual surveys of tree canopies and stems are simple, quick, and useful for assessing forest health in remote sensing studies that employ ground truthing. Using indexes of 0-5 (0 = no change, 5 = severe change) based on visual assessments of leaf color and leaf damage, defined as leaf color change, leaf wilting, holes/defoliation/pest and pathogen presence visible over > 50% of the leaf canopy; and stem damage defined as changes in bark color, texture, stem number, or significant sap residue, we analyzed changes associated with tree stress in 262 deciduous and 312 conifer trees from five sites encompassing different elevations, moisture regimes and burn severities imaged by NASA aircraft in 2017-2022 using AVIRIS-NG hyperspectral technology for the Arctic and Boreal Vulnerability Experiment (ABoVE). Our visual surveys from 2021-22 found greater leaf damage and average tree damage (mean of leaf and stem damage) in steeply sloped aspen and birch forest showing average June-August soil moisture < 50%, and average June-August soil temperatures that were 3.8 °C warmer than conifer forest soils. Leaf damage was lightest in unburned conifer forest associated with greater moss cover, soil moisture above 50%, and deeper thaw depths. Across burn severities, leaf damage was greatest in lightly burned open conifer forest with surviving trees, and stem damage was highest in severely burned conifer sites recruited by birch and aspen saplings. Leaf changes were mainly caused by pathogens or insects, while most stem changes were likely caused by browsing mammals. Increasing pest/pathogen loads on mature trees and saplings could affect carbon uptake and forest successional trajectories.
Mapping Shrub Abundance in Arctic Tundra from the Satellite High Resolution Record and Impacts on Albedo: Validation (Mark Chopping)
Theme: Vegetation Dynamics and Distribution (Wed 17:00 - 18:00)
- Poster #
6
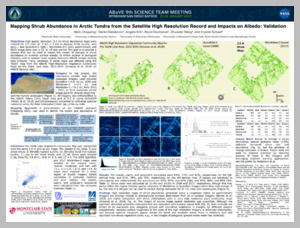
Mark Chopping (1), Darko Radakovic (1), Angela Erb (2), Rocio Duchesne-Onoro (3), Zhuosen Wang (4), Crystal Schaaf (2)
Montclair State University (1), University of Massachusetts Boston (2), University of Wisconsin - Whitewater (3), NASA GSFC/University of Maryland (4)
High resolution 2.5 m shrub abundance maps were created for 127sites of 2 km x 2 km in Alaskan Arctic tundra, with early / late QuickBird-2 (QB) / WorldView-2/3 (WV) panchromatic and NDVI image pairs over a 15- to 18-year period. The goal is to provide a dataset that can be used to assess the impact of changes in shrub abundance on summer surface albedo and to validate lower spatial resolution ABoVE remote sensing data products. The sequence of operations was: ortho-rectification of all imagery onto a 0.5 m grid using the Polar Geospatial Center code; raster-matching each WV panchromatic image to the corresponding QB image to account for differences in sun angle; conversion to 2.5 m shrub abundance maps by calculation of a roughness metric (st. dev.) in a 5 x 5 cell contiguous moving window, filtered by mean_NDVI >=0.35; validation against a very high resolution map; checks for limiting or anomalous conditions (polygonal ground, wet surface conditions, cloud contamination, poor illumination); comparisons with Landsat-derived aboveground biomass and cover maps; and comparisons to the MODIS albedo record from 2000-. Here, validation of the shrub maps was performed using the 'Toolik' map from the ABoVE 'High-Resolution Vegetation Community Maps for the Toolik Lake Area, 2013-2015' (Greaves et al. 2019; an ABoVE Sentinel site). The classes 0_No_Data, 5_Low dense shrub, 8_Shrubby tussock tundra, 10_Shrubby moist non-tussock tundra, 11_Low to tall moist shrub, and 12_Tall shrub were recoded 0_No_Data: 0; 5 & 8:1; 10 & 11: 2; and 12: 3. The 2009 QB and 2017 WV roughness maps were recoded to classes none, sparse, moderate, and tall, with <1.1, 1.1<1.5, 1.5<3, and >=3. All maps were masked for a small region of invalid imagery before calculation of confusion matrices and error metrics. The overall, user's, and producer's accuracies were 64%, 77%, and 82%, respectively, for the QB-derived map; and 61%, 78%, and 76%, respectively, for the WV-derived map. If classes are combined to none/sparse and moderate/tall, the respective accuracies are 82%, 87%, and 92% (QB); and 81%, 88%, and 89% (WV). Shrub cover was 11.4% and 14.5% in 2009 and 2017, respectively, though this may partly reflect the higher intrinsic resolution of the WV vs QB images rather than real change; if so, the rate of 0.39/year can be used to correct change estimates for the other 126 sites.
High resolution 2.5 m shrub abundance maps were created for 127sites of 2 km x 2 km in Alaskan Arctic tundra, with early / late QuickBird-2 (QB) / WorldView-2/3 (WV) panchromatic and NDVI image pairs over a 15- to 18-year period. The goal is to provide a dataset that can be used to assess the impact of changes in shrub abundance on summer surface albedo and to validate lower spatial resolution ABoVE remote sensing data products. The sequence of operations was: ortho-rectification of all imagery onto a 0.5 m grid using the Polar Geospatial Center code; raster-matching each WV panchromatic image to the corresponding QB image to account for differences in sun angle; conversion to 2.5 m shrub abundance maps by calculation of a roughness metric (st. dev.) in a 5 x 5 cell contiguous moving window, filtered by mean_NDVI >=0.35; validation against a very high resolution map; checks for limiting or anomalous conditions (polygonal ground, wet surface conditions, cloud contamination, poor illumination); comparisons with Landsat-derived aboveground biomass and cover maps; and comparisons to the MODIS albedo record from 2000-. Here, validation of the shrub maps was performed using the 'Toolik' map from the ABoVE 'High-Resolution Vegetation Community Maps for the Toolik Lake Area, 2013-2015' (Greaves et al. 2019; an ABoVE Sentinel site). The classes 0_No_Data, 5_Low dense shrub, 8_Shrubby tussock tundra, 10_Shrubby moist non-tussock tundra, 11_Low to tall moist shrub, and 12_Tall shrub were recoded 0_No_Data: 0; 5 & 8:1; 10 & 11: 2; and 12: 3. The 2009 QB and 2017 WV roughness maps were recoded to classes none, sparse, moderate, and tall, with <1.1, 1.1<1.5, 1.5<3, and >=3. All maps were masked for a small region of invalid imagery before calculation of confusion matrices and error metrics. The overall, user's, and producer's accuracies were 64%, 77%, and 82%, respectively, for the QB-derived map; and 61%, 78%, and 76%, respectively, for the WV-derived map. If classes are combined to none/sparse and moderate/tall, the respective accuracies are 82%, 87%, and 92% (QB); and 81%, 88%, and 89% (WV). Shrub cover was 11.4% and 14.5% in 2009 and 2017, respectively, though this may partly reflect the higher intrinsic resolution of the WV vs QB images rather than real change; if so, the rate of 0.39/year can be used to correct change estimates for the other 126 sites.
Mapping plant functional type cover across the ABoVE domain (Matthew Macander)
Theme: Vegetation Dynamics and Distribution (Wed 17:00 - 18:00)
- Poster #
8
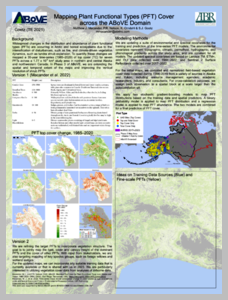
Matthew Macander (1), Peter Nelson (2), Kathleen Orndahl (3), Scott Goetz (3)
Alaska Biological Research, Inc.--Environmental Research & Services (1), Schoodic Institute (2), Northern Arizona University (3)
We are extending and refining plant functional type (PFT) time-series maps developed for Arctic and boreal Alaska and Yukon to cover the ABoVE core domain. We are compiling plot data and airborne mapping of PFTs to extend the spatial and temporal extent of our time-series maps, and to improve the vertical resolution of shrub PFTs (tall vs. low shrubs). We have updated the spectral predictors to incorporate Landsat Collection 2 and Sentinel 2 surface reflectance data; upgraded the prediction model to run at an annual time-step; and coupled it with an above-ground biomass prediction model for non-tree PFTs. We can incorporate any suitable training data that is currently available or that is shared with us by fall 2023.
We are extending and refining plant functional type (PFT) time-series maps developed for Arctic and boreal Alaska and Yukon to cover the ABoVE core domain. We are compiling plot data and airborne mapping of PFTs to extend the spatial and temporal extent of our time-series maps, and to improve the vertical resolution of shrub PFTs (tall vs. low shrubs). We have updated the spectral predictors to incorporate Landsat Collection 2 and Sentinel 2 surface reflectance data; upgraded the prediction model to run at an annual time-step; and coupled it with an above-ground biomass prediction model for non-tree PFTs. We can incorporate any suitable training data that is currently available or that is shared with us by fall 2023.
An Integration of Multi-scale Remote Sensing Reveals Different Controls of Alnus and Salix Distribution in low-Arctic Shrub Tundra (Daryl Yang)
Theme: Vegetation Dynamics and Distribution (Wed 17:00 - 18:00)
- Poster #
10

Daryl Yang (1), Wouter Hantson (2), Bailey Morrison (3), Charles Miller (4), Shawn Serbin (5)
Brookhaven National Lab (1), University of Maine (2), University of California, Merced (3), NASA JPL (4), Brookhaven National Laboratory (5)
The expansion of shrubs into Arctic tundra may fundamentally modify land-atmosphere interactions, with important implications for the global climate feedback. However, it remains unclear how shrub distribution and expansion differ across key species due to challenges with discriminating plant species in heterogeneous tundra landscapes. Here, we used multi-scale, multi-platform remote sensing to elucidate the distribution patterns and controls of two representative deciduous tall shrub (DTS) genera, Alnus and Salix, in low-Arctic tundra on the Seward Peninsula, Alaska. To do this, we derived pixel-wise fractional cover (fCover) maps for Alnus and Salix using scaling models that integrate high-resolution unmanned aerial system imagery and imaging spectroscopy from the Airborne Visible/Infrared Imaging Spectrometer - Next Generation. We show that topographic processes importantly controlled the distribution of DTSs, leading to a high degree of spatial heterogeneity in Alnus and Salix fCover. The establishment of Alnus was sensitive to elevation and slope and prospered in hilly uplands (>10°) within a specific elevation range (200 - 400 m). In contrast, Salix thrived on gentle slopes and required adequate soil moisture associated with its lower water use efficiency. We also show that niche differentiation between Alnus and Salix changed with community size, with larger communities being more specialized in resource requirements than individual plants or small patches of Alnus and Salix. To determine what environmental factor(s) confine the growth of DTS at locations with low fCover, we developed environmental limiting factor models for Alnus and Salix which showed that potential increase in Alnus and Salix fCover was limited by topographic factors in 69.2% and 48.7% of the landscape, respectively. These findings highlight a critical need to improve our ecological understanding and model representation of topography-controlled processes in regulating shrub distribution, as well as a need for more detailed classification to study shrub response to climate change in the Arctic.
The expansion of shrubs into Arctic tundra may fundamentally modify land-atmosphere interactions, with important implications for the global climate feedback. However, it remains unclear how shrub distribution and expansion differ across key species due to challenges with discriminating plant species in heterogeneous tundra landscapes. Here, we used multi-scale, multi-platform remote sensing to elucidate the distribution patterns and controls of two representative deciduous tall shrub (DTS) genera, Alnus and Salix, in low-Arctic tundra on the Seward Peninsula, Alaska. To do this, we derived pixel-wise fractional cover (fCover) maps for Alnus and Salix using scaling models that integrate high-resolution unmanned aerial system imagery and imaging spectroscopy from the Airborne Visible/Infrared Imaging Spectrometer - Next Generation. We show that topographic processes importantly controlled the distribution of DTSs, leading to a high degree of spatial heterogeneity in Alnus and Salix fCover. The establishment of Alnus was sensitive to elevation and slope and prospered in hilly uplands (>10°) within a specific elevation range (200 - 400 m). In contrast, Salix thrived on gentle slopes and required adequate soil moisture associated with its lower water use efficiency. We also show that niche differentiation between Alnus and Salix changed with community size, with larger communities being more specialized in resource requirements than individual plants or small patches of Alnus and Salix. To determine what environmental factor(s) confine the growth of DTS at locations with low fCover, we developed environmental limiting factor models for Alnus and Salix which showed that potential increase in Alnus and Salix fCover was limited by topographic factors in 69.2% and 48.7% of the landscape, respectively. These findings highlight a critical need to improve our ecological understanding and model representation of topography-controlled processes in regulating shrub distribution, as well as a need for more detailed classification to study shrub response to climate change in the Arctic.
A deep learning-based approach for mapping tall shrubs in Arctic tundra (Darko Radakovic)
Theme: Vegetation Dynamics and Distribution (Wed 17:00 - 18:00)
- Poster #
12

Darko Radakovic (1), Mark Chopping (1)
Montclair State University (1)
Advances have been made in attempting to improve the mapping of vegetation change and canopy cover over large areas at regional scales. In this research, we aim to improve the mapping and quantify tall shrubs in the Arctic, using machine learning (ML) techniques over a period of ~10-16 years. Our study investigates the use of ML models to assess changes in tall shrub succession in northern Alaska. To train and validate these models, we make use of high-resolution satellite imagery, obtained from QuickBird (~ 0.6 m) from around 2005 and Worldview2 (~0.4 m) and Worldview3 (~0.3 m) from around 2015 to 2021. We apply the YOLOv5 model (You only Look Once) for object detection of individual shrubs and the Detectron2 model for segmentation to identify diverse tundra landscape patches, such as dense tall shrub areas and polygonal ground in the satellite images. Validation of the object detection model with a high-resolution vegetation community map (± 0.02m) showed the presence of large numbers of false positives. However, we demonstrate that a Convolutional Neural Network (CNN) can be used as a filter to reduce false positives in object detection. In addition, we conduct experiments with different dataset sizes (25, 50 and 100 m subsets), image resolutions, and techniques including image augmentation and resizing to improve the mean Average Precision (mAP) of our models. Our results show that the use of pansharpened imagery leads to a higher mAP. Overall, our findings indicate that ML models can be effective in detecting large individual vegetation structures, such as tall shrubs, in normalized, high-resolution products, particularly during the summer months, and to improve the mapping of vegetation dynamics and canopy cover at regional scales in the Arctic within high resolution satellite products.
Advances have been made in attempting to improve the mapping of vegetation change and canopy cover over large areas at regional scales. In this research, we aim to improve the mapping and quantify tall shrubs in the Arctic, using machine learning (ML) techniques over a period of ~10-16 years. Our study investigates the use of ML models to assess changes in tall shrub succession in northern Alaska. To train and validate these models, we make use of high-resolution satellite imagery, obtained from QuickBird (~ 0.6 m) from around 2005 and Worldview2 (~0.4 m) and Worldview3 (~0.3 m) from around 2015 to 2021. We apply the YOLOv5 model (You only Look Once) for object detection of individual shrubs and the Detectron2 model for segmentation to identify diverse tundra landscape patches, such as dense tall shrub areas and polygonal ground in the satellite images. Validation of the object detection model with a high-resolution vegetation community map (± 0.02m) showed the presence of large numbers of false positives. However, we demonstrate that a Convolutional Neural Network (CNN) can be used as a filter to reduce false positives in object detection. In addition, we conduct experiments with different dataset sizes (25, 50 and 100 m subsets), image resolutions, and techniques including image augmentation and resizing to improve the mean Average Precision (mAP) of our models. Our results show that the use of pansharpened imagery leads to a higher mAP. Overall, our findings indicate that ML models can be effective in detecting large individual vegetation structures, such as tall shrubs, in normalized, high-resolution products, particularly during the summer months, and to improve the mapping of vegetation dynamics and canopy cover at regional scales in the Arctic within high resolution satellite products.
Unraveling the Complexities of Greening and Browning Trends in the Arctic Region from Landsat data (Yingtong Zhang)
Theme: Vegetation Dynamics and Distribution (Wed 17:00 - 18:00)
- Poster #
29
Yingtong Zhang (1), Curtis Woodcock (1)
Boston University (1)
Recent studies have used satellite-derived time series to explore the long-term greening or browning trends observed in the Arctic and Boreal Region, which are expected to be caused by soil moisture, topography, and the increasing or decreasing productivity due to climate change. The spectral indices such as NDVI, EVI, and LAI have been widely used as an indicator to connect those spotted trends to vegetation dynamics (e.g., tree mortality and recruitment, tundra greenness) and productivity. However, the time series of a simple vegetation index cannot reveal the complexity of underlying characteristics, causes, and feedbacks to the changing environment, or sometimes could lead to a contradictory conclusion from the ground truth. Here we used BRDF-corrected, cross-sensor calibrated time series of Landsat data to characterize the geographic patterns in greening and browning across in Arctic region and analyzed Tasseled Cap Brightness, Greenness, and Wetness trends from 1984 to 2021. We are comparing multiple common approaches such as simple linear regression (OLS), Theil Sen slope estimator, panel regression, and other segmentation methods adopted in previous studies and developed a new framework to examine the trends with respect to land cover, disturbances, topography, and climate drivers. The disturbance map, including the causal agent of fire, insect, logging, and others, from 1985 to 2020 was developed on Google Earth Engine based on the approach described in Zhang et al. (2022). The trend results were investigated by cross-referencing against ground measurements collected in 80 sites. The research is ongoing and more details will be available soon.
Recent studies have used satellite-derived time series to explore the long-term greening or browning trends observed in the Arctic and Boreal Region, which are expected to be caused by soil moisture, topography, and the increasing or decreasing productivity due to climate change. The spectral indices such as NDVI, EVI, and LAI have been widely used as an indicator to connect those spotted trends to vegetation dynamics (e.g., tree mortality and recruitment, tundra greenness) and productivity. However, the time series of a simple vegetation index cannot reveal the complexity of underlying characteristics, causes, and feedbacks to the changing environment, or sometimes could lead to a contradictory conclusion from the ground truth. Here we used BRDF-corrected, cross-sensor calibrated time series of Landsat data to characterize the geographic patterns in greening and browning across in Arctic region and analyzed Tasseled Cap Brightness, Greenness, and Wetness trends from 1984 to 2021. We are comparing multiple common approaches such as simple linear regression (OLS), Theil Sen slope estimator, panel regression, and other segmentation methods adopted in previous studies and developed a new framework to examine the trends with respect to land cover, disturbances, topography, and climate drivers. The disturbance map, including the causal agent of fire, insect, logging, and others, from 1985 to 2020 was developed on Google Earth Engine based on the approach described in Zhang et al. (2022). The trend results were investigated by cross-referencing against ground measurements collected in 80 sites. The research is ongoing and more details will be available soon.
Forest Canopy Height and Forest Species Mapping for Remote Sensing Retrieval of Near-surface Permafrost Active Layer Properties in Interior Alaska (Yuhuan Zhao)
Theme: Vegetation Dynamics and Distribution (Wed 17:00 - 18:00)
- Poster #
31
Yuhuan Zhao (1), Kazem Bakian-Dogaheh (1), Jane Whitcomb (1), Richard Chen (2), Yonghong Yi (3), John Kimball (4), Mahta Moghaddam (1)
University of Southern California (1), Jet Propulsion Laboratory (2), Tongji University (3), University of Montana (4)
Up to 80% boreal forest areas are underlain by permafrost. Boreal forest structure and species diversity are strong indicators of the presence of and depth to permafrost, since both vegetation and underlying soil processes are strongly interactive and sensitive to disturbance history and microclimate variability. In interior Alaska, forests are generally composed of five dominant tree species: white spruce, balsam poplar, black spruce, paper birch and quaking aspen. Relatively short black spruce stands occupy poorly drained and cold permafrost soils with shallow active layer thickness (ALT) (30-70 cm), while other forest species occupy more well-drained soils that are either permafrost-free or have deep ALT (>70 cm). Local (30m) scale mapping of forest canopy height (FCH) and forest species (FS) along regional environmental gradients can improve understanding of climate and disturbance impacts on forest structure and active layer conditions. These parameters may also enable more effective remote sensing retrievals of permafrost active layer properties, such as surface saturation fraction and ALT. We proposed a hybrid modeling framework using Random Forests (RF) to train a regression model to estimate FCH by integrating multi-frequency L-band (1.2 GHz) and P-band (420–440 MHz) UAVSAR and LVIS LiDAR data. A classification model was then trained to predict FS using multi-frequency UAVSAR, FCH, and Sentinel-1/-2 data. The experiments showed that the proposed method achieves relatively high precision for both FCH (RMSE=2.13 m, R2=0.83), and the FS classification (overall accuracy of 84.4%). The resulting well-trained models were employed to generate 30 m resolution FCH and FS maps for interior Alaska, showing statistical consistency with FIA forest inventory ground-truth data for forest species versus height. The maps also captured patterns in post-fire successional changes in FCH and FS following wildfire as indicated from regional fire history records (>10 years since disturbance). The analysis demonstrated the effectiveness of the proposed method and the accuracy of FCH and FS products. Furthermore, the preliminary subsurface retrieval results, based on the two maps, have shown the potential to retrieve accurate permafrost active layer properties in interior Alaska.
Up to 80% boreal forest areas are underlain by permafrost. Boreal forest structure and species diversity are strong indicators of the presence of and depth to permafrost, since both vegetation and underlying soil processes are strongly interactive and sensitive to disturbance history and microclimate variability. In interior Alaska, forests are generally composed of five dominant tree species: white spruce, balsam poplar, black spruce, paper birch and quaking aspen. Relatively short black spruce stands occupy poorly drained and cold permafrost soils with shallow active layer thickness (ALT) (30-70 cm), while other forest species occupy more well-drained soils that are either permafrost-free or have deep ALT (>70 cm). Local (30m) scale mapping of forest canopy height (FCH) and forest species (FS) along regional environmental gradients can improve understanding of climate and disturbance impacts on forest structure and active layer conditions. These parameters may also enable more effective remote sensing retrievals of permafrost active layer properties, such as surface saturation fraction and ALT. We proposed a hybrid modeling framework using Random Forests (RF) to train a regression model to estimate FCH by integrating multi-frequency L-band (1.2 GHz) and P-band (420–440 MHz) UAVSAR and LVIS LiDAR data. A classification model was then trained to predict FS using multi-frequency UAVSAR, FCH, and Sentinel-1/-2 data. The experiments showed that the proposed method achieves relatively high precision for both FCH (RMSE=2.13 m, R2=0.83), and the FS classification (overall accuracy of 84.4%). The resulting well-trained models were employed to generate 30 m resolution FCH and FS maps for interior Alaska, showing statistical consistency with FIA forest inventory ground-truth data for forest species versus height. The maps also captured patterns in post-fire successional changes in FCH and FS following wildfire as indicated from regional fire history records (>10 years since disturbance). The analysis demonstrated the effectiveness of the proposed method and the accuracy of FCH and FS products. Furthermore, the preliminary subsurface retrieval results, based on the two maps, have shown the potential to retrieve accurate permafrost active layer properties in interior Alaska.
Compiling a stacked data set with ground, UAV and airborne data for large scale lichen mapping in NWT, Canada (Maria Belke-Brea)
Theme: Vegetation Dynamics and Distribution (Wed 17:00 - 18:00)
- Poster #
33

Maria Belke-Brea (1), Jurjen van der Sluijs (2), Robert Fraser (3), Geneviève Degré-Timmons (4), Steven Cumming (4), Jennifer Baltzer (1)
Wilfrid Laurier University (1), Government of the Northwest Territories (2), Canada Centre for Mapping and Earth Observation (3), Université Laval (4)
In 2003 boreal caribou (Rangifer tarandus caribou) were listed as threatened species on a pan-Canadian scale, a state partly brought upon by habitat alteration and fragmentation. The identification, protection and restoration of high-quality habitat is thus key to long-term recovery and conservation of caribou. Cladonia spp. (caribou lichen) are important caribou forage in the winter. Mapping the distribution of caribou lichen biomass can help better understand the availability of high-quality habitat. This project aims to create a lichen abundance and distribution map for the Northwest Territories (NWT), home to the largest stable boreal caribou herd in Canada. For lichen mapping we use a combination of data from i) 48 ground vegetation plots (each consisting of five 1x1 m quadrats) where % lichen cover was measured, ii) 48 high-precision RGB UAV datasets with resolution ‹ 1cm and aerial coverage of ˜40m2, iii) spectroscopy data recorded by AVIRIS in 2017, 2018 and 2022 with a 5m resolution, and iv) Landsat satellite data with 30m resolution. In a first step, UAV data are classified into lichen/no lichen with a random forest model that uses a suite of spectral and topographic predictors. The resulting lichen abundance is validated using the 240 ground measurements collected in the vegetation plots. In a second step, the classified UAV datasets are upscaled, first to AVIRIS and then to Landsat resolution, and used to train random forest models that estimate lichen abundance from AVIRIS and Landsat data. This project is carried out in collaboration with the Government of the Northwest Territories, and the resulting large-scale lichen abundance and distribution map will be a useful tool for caribou range planning in NWT.
In 2003 boreal caribou (Rangifer tarandus caribou) were listed as threatened species on a pan-Canadian scale, a state partly brought upon by habitat alteration and fragmentation. The identification, protection and restoration of high-quality habitat is thus key to long-term recovery and conservation of caribou. Cladonia spp. (caribou lichen) are important caribou forage in the winter. Mapping the distribution of caribou lichen biomass can help better understand the availability of high-quality habitat. This project aims to create a lichen abundance and distribution map for the Northwest Territories (NWT), home to the largest stable boreal caribou herd in Canada. For lichen mapping we use a combination of data from i) 48 ground vegetation plots (each consisting of five 1x1 m quadrats) where % lichen cover was measured, ii) 48 high-precision RGB UAV datasets with resolution ‹ 1cm and aerial coverage of ˜40m2, iii) spectroscopy data recorded by AVIRIS in 2017, 2018 and 2022 with a 5m resolution, and iv) Landsat satellite data with 30m resolution. In a first step, UAV data are classified into lichen/no lichen with a random forest model that uses a suite of spectral and topographic predictors. The resulting lichen abundance is validated using the 240 ground measurements collected in the vegetation plots. In a second step, the classified UAV datasets are upscaled, first to AVIRIS and then to Landsat resolution, and used to train random forest models that estimate lichen abundance from AVIRIS and Landsat data. This project is carried out in collaboration with the Government of the Northwest Territories, and the resulting large-scale lichen abundance and distribution map will be a useful tool for caribou range planning in NWT.
Forecasting net forest biomass changes for land management in interior Alaska (Arden Burrell, Jacqueline Dean)
Theme: Vegetation Dynamics and Distribution (Wed 17:00 - 18:00)
- Poster #
35

Arden Burrell (1), Jacqueline Dean (1), Logan Berner (2), Scott Goetz (2), Matthew Macander (3), Laura Duncanson (4), Paul Montesano (5), Brendan Rogers (1)
Woodwell Climate Research Center (1), Northern Arizona University (2), Alaska Biological Research, Inc.--Environmental Research & Services (3), University of Maryland (4), NASA GSFC / ADNET (5)
Changes in boreal forests, including forest productivity and biomass, are important factors in calculating carbon budgets and informing management decisions. However, there is a lack of short-term, high-resolution predictions (5-30 years) of aboveground biomass changes tailored to specific sites. This study seeks to provide high resolution (30m) forecasts of aboveground biomass within interior Alaska. Using forest inventory data collected between 2001-2021 at various sites, we calculated tree and plot specific biomass using allometric equations specific to Alaska. We then predicted short-term aboveground biomass gains and losses using an ensemble of machine learning models that linked the biomass data with Landsat time series, climate, permafrost, and soil data. We have expanded this site level model to a 30m resolution gridded model by using gridded inputs to better map areas of interest to land managers. To allow easy access of biomass predictions for resource managers we then create a visualization application in Google Earth Engine that maps biomass predictions at a fine scale.
Changes in boreal forests, including forest productivity and biomass, are important factors in calculating carbon budgets and informing management decisions. However, there is a lack of short-term, high-resolution predictions (5-30 years) of aboveground biomass changes tailored to specific sites. This study seeks to provide high resolution (30m) forecasts of aboveground biomass within interior Alaska. Using forest inventory data collected between 2001-2021 at various sites, we calculated tree and plot specific biomass using allometric equations specific to Alaska. We then predicted short-term aboveground biomass gains and losses using an ensemble of machine learning models that linked the biomass data with Landsat time series, climate, permafrost, and soil data. We have expanded this site level model to a 30m resolution gridded model by using gridded inputs to better map areas of interest to land managers. To allow easy access of biomass predictions for resource managers we then create a visualization application in Google Earth Engine that maps biomass predictions at a fine scale.
Fire as a Driver of Increases in Photosynthesis in Boreal Forest Ecosystems of North America (Jinhyuk Kim)
Theme: Vegetation Dynamics and Distribution (Wed 17:00 - 18:00)
- Poster #
37

Jinhyuk Kim (1), Jonathan Wang (2), Claudia Czimczik (1), James Randerson (1)
University Of California, Irvine (1), University of Utah (2)
Observations of the annual cycle of atmospheric CO2 suggest increasing terrestrial metabolic activity, but the mechanisms driving these changes are not fully understood. Ecological change from disturbance, such as fire, has been hypothesized to increase the magnitude and change the seasonality of carbon fluxes through shifts in plant community composition. However little work has been done to evaluate this potential mechanism at regional scales. To understand how an intensifying fire regime contributes to long-term trends in terrestrial fluxes, here we investigate how fire disturbance influences landscape-scale photosynthesis across North America (NA) boreal forest ecosystems. We use a Landsat-derived land cover time series to identify plant functional types (PFTs) in Alaska and Canadian fire perimeters and solar-induced fluorescence (SIF) from OCO-2 as a proxy for photosynthesis. We find that wildfire reduces SIF in 2-9-year-old stands but increases in SIF by nearly 25% in 20-29-year-old stands, relative to pre-fire controls. We also find that postfire stands are composed of more deciduous vegetation than prefire stands and evidence for a fire-driven expansion of deciduous forests in boreal and taiga plain regions. Deciduous forests show considerably higher levels of SIF compared to evergreen forests and can be used to explain an enhancement of summer SIF in 20-29-year-old to 50-59-year-old stands. We conclude that there are two main mechanisms by which fires enhance photosynthesis in boreal forest ecosystems of NA. First, increasing fire disturbance shifts the stand age distribution, leading to increases in deciduous forests through post-fire succession. Second, fires are inducing a more permanent vegetation cover shift from evergreen forests to deciduous forests in plains regions. Our findings suggest that fires must be further explored and included in studies to understand long-term changes in terrestrial activity.
Observations of the annual cycle of atmospheric CO2 suggest increasing terrestrial metabolic activity, but the mechanisms driving these changes are not fully understood. Ecological change from disturbance, such as fire, has been hypothesized to increase the magnitude and change the seasonality of carbon fluxes through shifts in plant community composition. However little work has been done to evaluate this potential mechanism at regional scales. To understand how an intensifying fire regime contributes to long-term trends in terrestrial fluxes, here we investigate how fire disturbance influences landscape-scale photosynthesis across North America (NA) boreal forest ecosystems. We use a Landsat-derived land cover time series to identify plant functional types (PFTs) in Alaska and Canadian fire perimeters and solar-induced fluorescence (SIF) from OCO-2 as a proxy for photosynthesis. We find that wildfire reduces SIF in 2-9-year-old stands but increases in SIF by nearly 25% in 20-29-year-old stands, relative to pre-fire controls. We also find that postfire stands are composed of more deciduous vegetation than prefire stands and evidence for a fire-driven expansion of deciduous forests in boreal and taiga plain regions. Deciduous forests show considerably higher levels of SIF compared to evergreen forests and can be used to explain an enhancement of summer SIF in 20-29-year-old to 50-59-year-old stands. We conclude that there are two main mechanisms by which fires enhance photosynthesis in boreal forest ecosystems of NA. First, increasing fire disturbance shifts the stand age distribution, leading to increases in deciduous forests through post-fire succession. Second, fires are inducing a more permanent vegetation cover shift from evergreen forests to deciduous forests in plains regions. Our findings suggest that fires must be further explored and included in studies to understand long-term changes in terrestrial activity.
Two decades of post-disturbance land cover changes in Arctic and boreal ecosystems of North America (Kai-Ting Hu)
Theme: Vegetation Dynamics and Distribution (Wed 17:00 - 18:00)
- Poster #
39
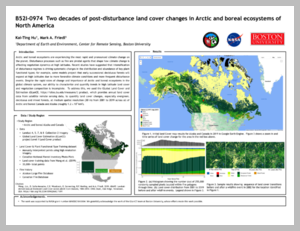
Kai-Ting Hu (1), Mark Friedl (1), Jonathan Wang (2)
Boston University, Earth and Environment (1), University of Utah, School of Biological Sciences (2)
Arctic and boreal ecosystems are experiencing the most rapid and pronounced climate change on the planet. Disturbance processes such as fire are pivotal agents that shape how climate change is affecting vegetation dynamics at high latitudes. Recent studies have suggested that intensification of disturbance regimes is driving systematic changes in the distribution and abundance of key plant functional types; for example, some models project that early successional deciduous forests will expand at high latitudes due to more favorable climate conditions and more frequent disturbance events. Despite the rapid rates of change and importance of Arctic and boreal ecosystems in the global climate system, our ability to characterize and quantify trends in high latitude land cover and vegetation composition is incomplete. To address this, we used the GLobal Land Cover and Estimation (GLanCE) product, which provides annual land cover data from satellite remote sensing data, to quantify land cover changes at moderate spatial resolution (30 m) from 2001 to 2019 across all of Arctic and boreal Canada and Alaska (roughly 1.2 × 10⁷ km2 ). Preliminary results identify a net decrease in area dominated by evergreen needleleaf forests and shrubs of 0.8 % (-1.3 × 10⁵ km2 ) and 9.8 % (-2.4 × 10⁴ km2 ), respectively, for the period 2001-2019. Similarly, our results indicate that deciduous forests and herbaceous land cover increased by 4.5% (8.7 × 10⁴ km2 ) and 3.9% (2.2 × 10⁵ km2 ), respectively, for the same period. A number of studies have shown that the early phase of post-disturbance succession determines the trajectory of vegetation regrowth, and specifically, whether or not the post-disturbance vegetation community shifts to a different composition or reverts to the same composition that it had before the disturbance. Leveraging the land cover change maps we are creating, in combination with historical information from the Alaska Large Fire Database and National Burned Area Composite database for Canada (NBAC), we analyzed land cover changes following historical disturbance events, and by extension to improve understanding of how climate change is altering the composition of high-latitude ecosystems.
Arctic and boreal ecosystems are experiencing the most rapid and pronounced climate change on the planet. Disturbance processes such as fire are pivotal agents that shape how climate change is affecting vegetation dynamics at high latitudes. Recent studies have suggested that intensification of disturbance regimes is driving systematic changes in the distribution and abundance of key plant functional types; for example, some models project that early successional deciduous forests will expand at high latitudes due to more favorable climate conditions and more frequent disturbance events. Despite the rapid rates of change and importance of Arctic and boreal ecosystems in the global climate system, our ability to characterize and quantify trends in high latitude land cover and vegetation composition is incomplete. To address this, we used the GLobal Land Cover and Estimation (GLanCE) product, which provides annual land cover data from satellite remote sensing data, to quantify land cover changes at moderate spatial resolution (30 m) from 2001 to 2019 across all of Arctic and boreal Canada and Alaska (roughly 1.2 × 10⁷ km2 ). Preliminary results identify a net decrease in area dominated by evergreen needleleaf forests and shrubs of 0.8 % (-1.3 × 10⁵ km2 ) and 9.8 % (-2.4 × 10⁴ km2 ), respectively, for the period 2001-2019. Similarly, our results indicate that deciduous forests and herbaceous land cover increased by 4.5% (8.7 × 10⁴ km2 ) and 3.9% (2.2 × 10⁵ km2 ), respectively, for the same period. A number of studies have shown that the early phase of post-disturbance succession determines the trajectory of vegetation regrowth, and specifically, whether or not the post-disturbance vegetation community shifts to a different composition or reverts to the same composition that it had before the disturbance. Leveraging the land cover change maps we are creating, in combination with historical information from the Alaska Large Fire Database and National Burned Area Composite database for Canada (NBAC), we analyzed land cover changes following historical disturbance events, and by extension to improve understanding of how climate change is altering the composition of high-latitude ecosystems.
Using Landsat to Map 21st Century Changes in Land Cover in Arctic and Boreal North America (Eleanor Horvath)
Theme: Vegetation Dynamics and Distribution (Wed 17:00 - 18:00)
- Poster #
41
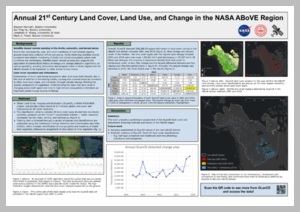
Eleanor Horvath (1), Kai-Ting Hu (1), Jonathan Wang (2), Zhe Zhu (3), Mark Friedl (1)
Boston University (1), University of Utah (2), University of Connecticut (3)
Arctic and boreal ecoregions are tightly coupled to the climate system and are therefore disproportionately vulnerable to climate change. Disturbance events including wildfires, insect and disease outbreaks, land cover conversion for human use, and other anthropogenic and climate-driven processes are causing large-scale land cover changes in Arctic and boreal ecosystems. Unfortunately, however, the geographic extent and remoteness of boreal and Arctic regions create challenges for studies focused on large-scale ecological change in these systems. Remote sensing-based methods provide useful and important tools for monitoring Arctic and boreal land use, land cover, and disturbance over large areas and across time.
The Global Land Cover Mapping and Estimation (GLanCE) initiative, a NASA MEaSUREs project at Boston University, is creating annual land cover and change maps for the 21st century at 30-meter resolution using the Continuous Change Detection and Classification algorithm. In this poster, we describe research that leverages data sets and products from GLanCE to map and monitor land cover and land cover change in the ABoVE core study domain. Specifically, we report initial results characterizing the dominant changes in land cover in the ABoVE study region captured by the GLanCE data set from 2000-2019. By area, the largest land cover changes detected were loss of tree cover and an increase in herbaceous cover; the former was concentrated in boreal zones, while the latter was mostly concentrated at higher latitudes in the tundra. As part of our analysis, we investigated spatial and temporal dynamics of tree cover gain and loss, herbaceous and shrub cover gains, and conversion of tree cover to herbaceous and shrub cover, as identified in the GLanCE results. Moving forward, we plan to refine our analysis based on updated results from GLanCE and to collect reference data in support of a detailed accuracy assessment of GLanCE mapping results in the ABoVE core study domain.
Airborne Lidar Measurements of Atmospheric Column CO2 Concentrations to Cloud Tops in the Arctic (Jianping Mao)
Theme: Carbon Dynamics (Mon 17:00 - 18:00)
- Poster #
1

Jianping Mao (1), James Abshire (2), Xiaoli Sun (3), Paul Kolbeck (4), Stephan Kawa (3)
NASA GSFC/University of Maryland (1), NASA GSFC & University of Maryland (2), NASA GSFC (3), University of Maryland (4)
Globally measurements of atmospheric CO2 concentrations with full seasonal sampling, low bias, and high precision are needed to advance carbon cycle sciences. However, two thirds of the Earth’s surface is covered by clouds, and passive remote sensing approaches from space are limited to measurements in sunlit cloud-free scenes. This is a significant limitation to passive satellite measurements of CO2 and CH4 across the Arctic and in the ABoVE domain. NASA Goddard’s airborne CO2 Sounder lidar is a pulsed, multiwavelength integrated-path differential absorption (IPDA) lidar that measures height-resolved laser backscatter profiles along with atmospheric column CO2 concentrations, XCO2. In previous airborne campaigns we have shown this approach allows accurately measuring range and XCO2 to cloud tops in addition to those the ground. We have recently applied this technique to analyze airborne lidar measurements from the summer 2017 ABoVE/ASCENDS airborne campaign. In addition to transit flights from/to California, the campaign had two flights in northern Canada and two in Alaska, with 27 flight hours in the Arctic. The atmosphere in the Arctic was more dynamic and cloudier and the lidar measurement conditions there were more challenging. We used the 22 spiral-down maneuvers in the Arctic to assess the accuracy of the lidar’s XCO2 measurements to the ground and to the cloud tops against in situ measurements made on the aircraft. Here we will show retrievals of XCO2 made to ground and many to cloud tops for these flights. The results show the lidar measurements of partial column XCO2 to cloud tops and cloud slicing approach helped resolve vertical and horizontal gradients of CO2 in cloudy conditions. Adding this new lidar measurement capability to future airborne campaigns and space missions will increase global and seasonal measurement coverage and will provide new information about the vertical structure of CO2. This will benefit atmospheric transport process studies, carbon data assimilation in models, and estimates of regional global carbon fluxes.
Globally measurements of atmospheric CO2 concentrations with full seasonal sampling, low bias, and high precision are needed to advance carbon cycle sciences. However, two thirds of the Earth’s surface is covered by clouds, and passive remote sensing approaches from space are limited to measurements in sunlit cloud-free scenes. This is a significant limitation to passive satellite measurements of CO2 and CH4 across the Arctic and in the ABoVE domain. NASA Goddard’s airborne CO2 Sounder lidar is a pulsed, multiwavelength integrated-path differential absorption (IPDA) lidar that measures height-resolved laser backscatter profiles along with atmospheric column CO2 concentrations, XCO2. In previous airborne campaigns we have shown this approach allows accurately measuring range and XCO2 to cloud tops in addition to those the ground. We have recently applied this technique to analyze airborne lidar measurements from the summer 2017 ABoVE/ASCENDS airborne campaign. In addition to transit flights from/to California, the campaign had two flights in northern Canada and two in Alaska, with 27 flight hours in the Arctic. The atmosphere in the Arctic was more dynamic and cloudier and the lidar measurement conditions there were more challenging. We used the 22 spiral-down maneuvers in the Arctic to assess the accuracy of the lidar’s XCO2 measurements to the ground and to the cloud tops against in situ measurements made on the aircraft. Here we will show retrievals of XCO2 made to ground and many to cloud tops for these flights. The results show the lidar measurements of partial column XCO2 to cloud tops and cloud slicing approach helped resolve vertical and horizontal gradients of CO2 in cloudy conditions. Adding this new lidar measurement capability to future airborne campaigns and space missions will increase global and seasonal measurement coverage and will provide new information about the vertical structure of CO2. This will benefit atmospheric transport process studies, carbon data assimilation in models, and estimates of regional global carbon fluxes.
Boreal Peatland C Storage and Emissions from Extreme Wildfire (Dorthea Vander Bilt, Laura Bourgeau-Chavez)
Theme: Carbon Dynamics (Mon 17:00 - 18:00)
- Poster #
3
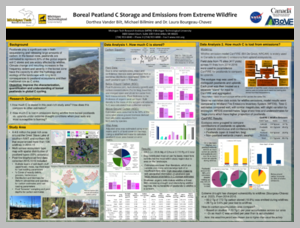
Dorthea Vander Bilt (1), Laura Bourgeau-Chavez (2), Michael Billmire (3)
Michigan Tech Research Institute (1), Michigan Technological University (2), Michigan Tech Research Institute (MTRI) (3)
Peatlands represent a belowground carbon pool that occurs on merely 3-5% of the land surface, but represents the largest C store of the terrestrial biosphere. The largest peatland C pools are in the boreal region which cover 25-30% of the boreal forest landscape. Peatlands represent a C storage and sequestration pool that can most readily be conserved and restored as a strategy to help mitigate climate change. The United Nations is currently conducting a Global Peatland Assessment towards the goal of increasing awareness of the world’s peatlands for sustained conservation and restoration. The characterization, quantification and understanding of peatlands in global C cycling is critical for proper accounting given that peatlands play a significant role in sequestering and releasing large amounts of carbon. Critical to any peatland assessment is development of accurate maps of the geospatial location of various peatland typologies coupled with accurate field data to quantify peat depth and to estimate C stores. Using a combination of optical and microwave sensors from multiple seasons within a given subregion allows for the characterization of peatland typologies. Such an approach was used to produce high accuracy peatland maps in the Northwest Territories Canada (NWT) study area that were used in conjunction with in situ soil C measures to provide improved accounting of C-storage estimates from broad peatland complexes of the Taiga plains and small peatlands of the rocky Canadian Shield. In the region of southern NWT where peatlands cover more than 75% of the landscape, extreme drought in 2014-15 resulted in more than 3.4 M ha of wildfire. Research was conducted to understand the effects of these widespread wildfires on peatlands in comparison to uplands that traverse the taiga shield and taiga plain ecozones and gradients of severity of burn and seasons of fire. We parameterized the CanFIRE fire effects and emissions model for peatlands and applied the model to the largest fires of NWT. Results show that more C is emitted from peatlands than uplands during these extreme fire years. Climate induced changes to wildfire regimes is one of the largest threats to peatland ecosystem function and continued C sequestration.
Peatlands represent a belowground carbon pool that occurs on merely 3-5% of the land surface, but represents the largest C store of the terrestrial biosphere. The largest peatland C pools are in the boreal region which cover 25-30% of the boreal forest landscape. Peatlands represent a C storage and sequestration pool that can most readily be conserved and restored as a strategy to help mitigate climate change. The United Nations is currently conducting a Global Peatland Assessment towards the goal of increasing awareness of the world’s peatlands for sustained conservation and restoration. The characterization, quantification and understanding of peatlands in global C cycling is critical for proper accounting given that peatlands play a significant role in sequestering and releasing large amounts of carbon. Critical to any peatland assessment is development of accurate maps of the geospatial location of various peatland typologies coupled with accurate field data to quantify peat depth and to estimate C stores. Using a combination of optical and microwave sensors from multiple seasons within a given subregion allows for the characterization of peatland typologies. Such an approach was used to produce high accuracy peatland maps in the Northwest Territories Canada (NWT) study area that were used in conjunction with in situ soil C measures to provide improved accounting of C-storage estimates from broad peatland complexes of the Taiga plains and small peatlands of the rocky Canadian Shield. In the region of southern NWT where peatlands cover more than 75% of the landscape, extreme drought in 2014-15 resulted in more than 3.4 M ha of wildfire. Research was conducted to understand the effects of these widespread wildfires on peatlands in comparison to uplands that traverse the taiga shield and taiga plain ecozones and gradients of severity of burn and seasons of fire. We parameterized the CanFIRE fire effects and emissions model for peatlands and applied the model to the largest fires of NWT. Results show that more C is emitted from peatlands than uplands during these extreme fire years. Climate induced changes to wildfire regimes is one of the largest threats to peatland ecosystem function and continued C sequestration.
Accounting for complex landscapes in eddy covariance fluxes and effects on carbon budgets when scaling in heterogeneous tundra and wetlands (Sarah Ludwig)
Theme: Carbon Dynamics (Mon 17:00 - 18:00)
- Poster #
5

Sarah Ludwig (1), Luke Schiferl (2), Jacqueline Hung (3), Susan Natali (3), Róisín Commane (1)
Columbia University (1), Lamont-Doherty Earth Observatory (2), Woodwell Climate Research Center (3)
As the Arctic is warming at an accelerated rate, recent research has shown that the Arctic is switching from a net sink to a net source of carbon (C) to the atmosphere in some locations. Tundra ecosystems are heterogeneous at multiple scales, with variation in plant functional types, soil moisture, and microtopography, for example, influencing net ecosystem exchange (NEE). Eddy covariance fluxes are used to interpret landscape carbon emissions and scale up to estimate carbon budgets, though the landscape ‘seen’ by flux towers is variable with wind direction, speed, and atmospheric conditions. Landscape heterogeneity is often ignored in eddy covariance footprints, which can lead to biases when scaling tower fluxes. In this study we report results from summer and shoulder-season NEE carbon dioxide fluxes from an eddy covariance tower in the Yukon-Kuskokwim Delta in Alaska. We used exponential temperature responses for respiration and a hyperbolic light saturation model of NEE (Shaver et al. 2007) to derive landcover specific NEE fluxes in the tower footprint. We estimated flux parameters by combining Bayesian inference, Markov Chain Monte Carlo (MCMC) sampling and analytical footprint models to decompose tower NEE observations into landcover specific fluxes based on high resolution landcover maps of the tower region. We found that traditional gap filling methods that assume homogeneous landscapes overestimated C uptake, leading to 2-4X greater C sink when compared to C budgets that account for landscape heterogeneity when scaling. Three different analytical footprint models created slightly different influence maps, which when convolved with landcover maps, led to small changes in flux attribution and C budgets. Areas of degrading permafrost and small ponds contributed disproportionately high fluxes in August and September, enough to offset C uptake from other landcovers, despite being <5% of the landscape area. This study presents how Bayesian MCMC, analytical footprint models, and high resolution landcover maps can be leveraged to derive detailed landcover fluxes from eddy covariance timeseries. These results demonstrate the importance of landscape heterogeneity when scaling C emissions in the arctic.
As the Arctic is warming at an accelerated rate, recent research has shown that the Arctic is switching from a net sink to a net source of carbon (C) to the atmosphere in some locations. Tundra ecosystems are heterogeneous at multiple scales, with variation in plant functional types, soil moisture, and microtopography, for example, influencing net ecosystem exchange (NEE). Eddy covariance fluxes are used to interpret landscape carbon emissions and scale up to estimate carbon budgets, though the landscape ‘seen’ by flux towers is variable with wind direction, speed, and atmospheric conditions. Landscape heterogeneity is often ignored in eddy covariance footprints, which can lead to biases when scaling tower fluxes. In this study we report results from summer and shoulder-season NEE carbon dioxide fluxes from an eddy covariance tower in the Yukon-Kuskokwim Delta in Alaska. We used exponential temperature responses for respiration and a hyperbolic light saturation model of NEE (Shaver et al. 2007) to derive landcover specific NEE fluxes in the tower footprint. We estimated flux parameters by combining Bayesian inference, Markov Chain Monte Carlo (MCMC) sampling and analytical footprint models to decompose tower NEE observations into landcover specific fluxes based on high resolution landcover maps of the tower region. We found that traditional gap filling methods that assume homogeneous landscapes overestimated C uptake, leading to 2-4X greater C sink when compared to C budgets that account for landscape heterogeneity when scaling. Three different analytical footprint models created slightly different influence maps, which when convolved with landcover maps, led to small changes in flux attribution and C budgets. Areas of degrading permafrost and small ponds contributed disproportionately high fluxes in August and September, enough to offset C uptake from other landcovers, despite being <5% of the landscape area. This study presents how Bayesian MCMC, analytical footprint models, and high resolution landcover maps can be leveraged to derive detailed landcover fluxes from eddy covariance timeseries. These results demonstrate the importance of landscape heterogeneity when scaling C emissions in the arctic.
Synthesis of Arctic-Boreal region biogenic methane fluxes, model-data mismatch, and knowledge gaps (Luke Schiferl)
Theme: Carbon Dynamics (Mon 17:00 - 18:00)
- Poster #
7
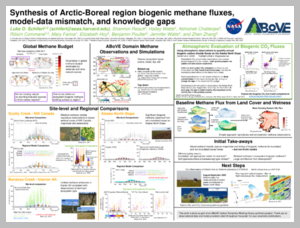
Luke Schiferl (1), Shannon Reault (2), Hailey Webb (3), Abhishek Chatterjee (4), Róisín Commane (5), Mary Farina (6), Elizabeth Hoy (7), Benjamin Poulter (8), Jennifer Watts (3), Zhen Zhang (9)
Lamont-Doherty Earth Observatory (1), Clark University (2), Woodwell Climate Research Center (3), NASA JPL (4), Columbia University (5), Montana State University (6), NASA GSFC / Global Science and Technology, Inc. (7), NASA GSFC (8), University of Maryland (9)
Thawing permafrost has the potential to release large amounts of heat-trapping methane gas into the atmosphere, thereby accelerating global warming. Much work has been done to both observe and simulate current and potential future biogenic methane fluxes throughout the Arctic-Boreal region of North America. This study identifies key regions of methane emissions and uptake by combining available flux observations and a set of regional and global models. We compare the simulated methane fluxes to observations from eddy flux tower sites and evaluate them using atmospheric methane concentration observations coupled to an atmospheric transport model. This analysis allows us to investigate where, when and why models do and do not match the observations, which can guide the focus for future model improvements and the potential usefulness of additional observational constraints. We find that global wetland models perform well for boreal wetlands in northwestern Canada, but tend to underestimate methane emissions observed by both eddy flux and aircraft over the Alaska North Slope. The lack of simulated wetland methane in this region suggests wetland classification may not be the best indicator of methane emissions in tundra areas. The regional model with more particular representation of Arctic ecosystems performs better for the Alaska North Slope, however, producing significant methane to match the aircraft observations. We also investigate the use of wetness as a metric for methane emissions in areas not classified as wetlands. Overall, this work can provide recommendations for future studies in this region, including insights into our level of understanding for various drivers of methane flux.
Thawing permafrost has the potential to release large amounts of heat-trapping methane gas into the atmosphere, thereby accelerating global warming. Much work has been done to both observe and simulate current and potential future biogenic methane fluxes throughout the Arctic-Boreal region of North America. This study identifies key regions of methane emissions and uptake by combining available flux observations and a set of regional and global models. We compare the simulated methane fluxes to observations from eddy flux tower sites and evaluate them using atmospheric methane concentration observations coupled to an atmospheric transport model. This analysis allows us to investigate where, when and why models do and do not match the observations, which can guide the focus for future model improvements and the potential usefulness of additional observational constraints. We find that global wetland models perform well for boreal wetlands in northwestern Canada, but tend to underestimate methane emissions observed by both eddy flux and aircraft over the Alaska North Slope. The lack of simulated wetland methane in this region suggests wetland classification may not be the best indicator of methane emissions in tundra areas. The regional model with more particular representation of Arctic ecosystems performs better for the Alaska North Slope, however, producing significant methane to match the aircraft observations. We also investigate the use of wetness as a metric for methane emissions in areas not classified as wetlands. Overall, this work can provide recommendations for future studies in this region, including insights into our level of understanding for various drivers of methane flux.
The biological basis for using optical signals to track evergreen photosynthesis (Zoe Pierrat)
Theme: Carbon Dynamics (Mon 17:00 - 18:00)
- Poster #
9
Zoe Pierrat (1), Troy Magney (2), David Bowling (3), Barry Logan (4), Jaret Reblin (4), Sara Nelson (4), Andrew Richardson (5), Chris Wong (2), Rui Cheng (6), Mukund Rao (2), Magali Nehemy (7), Jochen Stutz (8)
University of California (1), University of California Davis (2), University of Utah (3), Bowdoin College (4), Northern Arizona University (5), Massachusetts Institute of Technology (6), Trent University (7), University of California Los Angeles (8)
Due to their vast extent, evergreen needleleaf forests (ENFs) play a sizable role in the global carbon cycle; by some estimates Boreal ENFs, alone, are responsible for more than 30% of terrestrial carbon storage. Despite their importance, the biological and physical controls on ENF carbon cycle feedbacks are poorly understood, and difficult to measure. To reconcile this, a growing appreciation for the stress physiology of photosynthesis has inspired emerging technology designed to remotely detect evergreen photosynthetic activity - which has traditionally been challenging due to their pervasive ‘greenness’. Work of this kind is multi-disciplinary in nature and can serve as a model for coordination and integration of observations made at multiple scales by scientists from different fields. Here, we present an overview of measurements that link leaf and stand-scale observations of photosynthesis (i.e. needle biochemistry and flux towers) with satellite/tower-based remote to scale our understanding of ENF carbon dynamics. We reconcile the gaps between these scales, with an emphasis on how fundamental plant biological and biophysical processes control the fate of photons from leaf to globe, ultimately enabling remote estimates of the seasonality of photosynthetic activity in ENFs.
Due to their vast extent, evergreen needleleaf forests (ENFs) play a sizable role in the global carbon cycle; by some estimates Boreal ENFs, alone, are responsible for more than 30% of terrestrial carbon storage. Despite their importance, the biological and physical controls on ENF carbon cycle feedbacks are poorly understood, and difficult to measure. To reconcile this, a growing appreciation for the stress physiology of photosynthesis has inspired emerging technology designed to remotely detect evergreen photosynthetic activity - which has traditionally been challenging due to their pervasive ‘greenness’. Work of this kind is multi-disciplinary in nature and can serve as a model for coordination and integration of observations made at multiple scales by scientists from different fields. Here, we present an overview of measurements that link leaf and stand-scale observations of photosynthesis (i.e. needle biochemistry and flux towers) with satellite/tower-based remote to scale our understanding of ENF carbon dynamics. We reconcile the gaps between these scales, with an emphasis on how fundamental plant biological and biophysical processes control the fate of photons from leaf to globe, ultimately enabling remote estimates of the seasonality of photosynthetic activity in ENFs.
Following the white rabbit: tracing the fate of permafrost-derived carbon in Arctic tundra river networks (Melissa Schwab)
Theme: Carbon Dynamics (Mon 17:00 - 18:00)
- Poster #
11
Melissa Schwab (1), Clayton Elder (2), Xiaomei Xu (3), Claudia Czimczik (3), Charles Miller (1)
NASA JPL (1), Jet Propulsion Laboratory (2), University of California, Irvine (3)
In a continuously warming world, permafrost soils are subjected to progressive thawing, leading on the one hand to abrupt thermomechanical erosion and on the other to the gradual formation of hydrological connectivity linking groundwater and surface water. We present a spatiotemporal record of dissolved CO2 and CH4 isotopic compositions, major ions, and optical properties assessing the presence of permafrost-derived carbon in two river networks on the North Slope, Alaska. From spring to fall, dissolved organic carbon concentrations increase concomitantly with a depletion in CO2-δ13C signatures and a decline in specific UV absorbance. We interpret this pattern as a stronger respiratory signal of biogenic sources leached from permafrost soils following a deepening of the active layer. In contrast to greenhouse gas emissions from lakes situated on the North Slope, fluvial CO2 and CH4 fractions are more 14C-depleted. In addition, dissolved CH4 is consistently more enriched in 14C relative to corresponding CO2, suggesting a primarily modern carbon source, while 13C isotopes indicate a predominance of acetoclastic methanogenesis. The enhanced collapse of river banks profoundly alters local stream chemistry and is manifested in the increased export of dissolved organic carbon and ammonium and a decrease in major cations. Our results highlight the sensitivity of organic and inorganic carbon production and release in response to the spatial and temporal variability of permafrost degradation at a watershed scale.
In a continuously warming world, permafrost soils are subjected to progressive thawing, leading on the one hand to abrupt thermomechanical erosion and on the other to the gradual formation of hydrological connectivity linking groundwater and surface water. We present a spatiotemporal record of dissolved CO2 and CH4 isotopic compositions, major ions, and optical properties assessing the presence of permafrost-derived carbon in two river networks on the North Slope, Alaska. From spring to fall, dissolved organic carbon concentrations increase concomitantly with a depletion in CO2-δ13C signatures and a decline in specific UV absorbance. We interpret this pattern as a stronger respiratory signal of biogenic sources leached from permafrost soils following a deepening of the active layer. In contrast to greenhouse gas emissions from lakes situated on the North Slope, fluvial CO2 and CH4 fractions are more 14C-depleted. In addition, dissolved CH4 is consistently more enriched in 14C relative to corresponding CO2, suggesting a primarily modern carbon source, while 13C isotopes indicate a predominance of acetoclastic methanogenesis. The enhanced collapse of river banks profoundly alters local stream chemistry and is manifested in the increased export of dissolved organic carbon and ammonium and a decrease in major cations. Our results highlight the sensitivity of organic and inorganic carbon production and release in response to the spatial and temporal variability of permafrost degradation at a watershed scale.
Predictions of structure and compositional change across the North American taiga-tundra ecotone (Paul Montesano)
Theme: Modeling (Tue 17:00 - 18:00)
- Poster #
38

Amanda Armstrong (1), Paul Montesano (2), Batuhan Osmanoglu (3), Elise Heffernan (4), Bradley Gay (5), Herman Shugart (4), Kenneth Ranson (3), Howard Epstein (4)
NASA GSFC / USRA GESTAR (1), NASA GSFC / ADNET (2), NASA GSFC (3), University of Virginia (4), George Mason University (5)
Boreal forests are expected to shift as the result of persistent warming in the northern high latitudes, and some of these shifts may occur in and near the boreal (taiga) - tundra ecotone (TTE). However, the rates, patterns, and location of these shifts will likely reflect the heterogeneity in the environmental drivers of forest structure. We've used key remote sensing datasets to update the hi-resolution individual-based forest growth model called SIBBORK-TTE in order to enable detailed simulations of forest structure and compositional change across a diverse set of heterogeneous sites along the TTE. Our simulations track current and future (~2100) changes across TTE sites in Alaska and Canada. The simulations future-casted with CMIP6 SSP585 scenario show patterns of increased AGB in white spruce across the Alaskan TTE, with some black spruce declines in the NW Canadian TTE. Our results provide some insight into the spatial variability in the direction, rate, and magnitude of some shifts in forest structure at the cold edge of the boreal.
Boreal forests are expected to shift as the result of persistent warming in the northern high latitudes, and some of these shifts may occur in and near the boreal (taiga) - tundra ecotone (TTE). However, the rates, patterns, and location of these shifts will likely reflect the heterogeneity in the environmental drivers of forest structure. We've used key remote sensing datasets to update the hi-resolution individual-based forest growth model called SIBBORK-TTE in order to enable detailed simulations of forest structure and compositional change across a diverse set of heterogeneous sites along the TTE. Our simulations track current and future (~2100) changes across TTE sites in Alaska and Canada. The simulations future-casted with CMIP6 SSP585 scenario show patterns of increased AGB in white spruce across the Alaskan TTE, with some black spruce declines in the NW Canadian TTE. Our results provide some insight into the spatial variability in the direction, rate, and magnitude of some shifts in forest structure at the cold edge of the boreal.
Using TLS-Measured Tree Attributes to Estimate Aboveground Biomass in Small Black Spruce Trees (Guillermo Castilla)
Theme: Modeling (Tue 17:00 - 18:00)
- Poster #
40
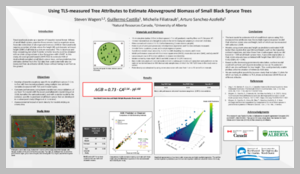
Steven Wagers (1), Guillermo Castilla (1), Filiatrault Michelle (1), Arturo Sanchez-Azofeifa (2)
Canadian Forest Service (1), University of Alberta (2)
Black spruce is the most common tree species in the nearly 100 million hectares of treed peatlands in Canada’s boreal forest. Half of the dry weight of those small trees is carbon; hence, accurate estimation of their above ground biomass (AGB) is important for understanding and modelling the role of northern forests as carbon sinks. Allometric equations are often used to estimate AGB, but they rely on diameter at breast height (DBH), which is hard to measure from the air. In this study, we created models to estimate AGB of small peatland black spruce (<5 m tall) in the Taiga Plains ecozone of the Northwest Territories that use as predictors attributes that can potentially be measured from above, such as tree bounding box volume, crown area/diameter and height. We derived those attributes from terrestrial laser scanning (TLS) data acquired over 10 plots where we destructively sampled ten trees per plot. We assessed the accuracy of the different models, determined which TLS-measured attributes led to the best results, and compared our results to those from DBH-based equations. Using conventional allometric equations with lab-measured height and DBH as predictors, the RMSE was 0.51 kg, 30% of the average AGB. In contrast, our best model, which used crown area and height as predictors, yielded significantly better results (when leave-one-plot-out crossvalidation was used, the RMSE was 0.39 kg, or 23% of the average AGB). This opens the door for using high density airborne lidar to accurately predict AGB across large swaths of black spruce peatlands without having to establish ground plots.
Black spruce is the most common tree species in the nearly 100 million hectares of treed peatlands in Canada’s boreal forest. Half of the dry weight of those small trees is carbon; hence, accurate estimation of their above ground biomass (AGB) is important for understanding and modelling the role of northern forests as carbon sinks. Allometric equations are often used to estimate AGB, but they rely on diameter at breast height (DBH), which is hard to measure from the air. In this study, we created models to estimate AGB of small peatland black spruce (<5 m tall) in the Taiga Plains ecozone of the Northwest Territories that use as predictors attributes that can potentially be measured from above, such as tree bounding box volume, crown area/diameter and height. We derived those attributes from terrestrial laser scanning (TLS) data acquired over 10 plots where we destructively sampled ten trees per plot. We assessed the accuracy of the different models, determined which TLS-measured attributes led to the best results, and compared our results to those from DBH-based equations. Using conventional allometric equations with lab-measured height and DBH as predictors, the RMSE was 0.51 kg, 30% of the average AGB. In contrast, our best model, which used crown area and height as predictors, yielded significantly better results (when leave-one-plot-out crossvalidation was used, the RMSE was 0.39 kg, or 23% of the average AGB). This opens the door for using high density airborne lidar to accurately predict AGB across large swaths of black spruce peatlands without having to establish ground plots.
Detecting changes in the high-latitude carbon seasonal cycle with a multi-model approach (Aleya Kaushik)
Theme: Modeling (Tue 17:00 - 18:00)
- Poster #
42
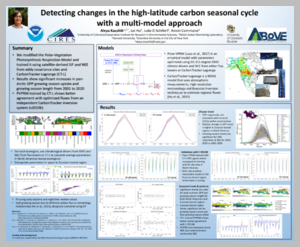
Aleya Kaushik (1), Lei Hu (2), Róisín Commane (3), Luke Schiferl (4)
NOAA GML / CU CIRES (1), NOAA GML (2), Columbia University (3), Lamont-Doherty Earth Observatory (4)
High-latitude amplification of the CO2 seasonal cycle has been well documented in long-term atmospheric observations since the 1960s. However, understanding the cause of the increasing amplitude remains challenging. Candidate theories include warming-induced earlier onset of vegetation growth and enhanced respiration in the fall, as well as mid-latitude transport of signals from increased agriculture production. We leverage NASA’s ABoVE data products, satellite-derived solar induced fluorescence (SIF) and state-of-the-science empirical and inverse modeling capabilities to partition net ecosystem exchange (NEE) into gross primary productivity (GPP) and respiration. A simple, empirical framework was constructed with the Polar Vegetation Photosynthesis and Respiration Model (Polar-VPRM), which uses reanalysis climatology from ERA5, satellite-based SIF and eddy covariance (EC) flux tower measurements to estimate parameters corresponding to each vegetation type documented by Ameriflux and Fluxnet sites across the Arctic. These parameters are then used to calculate GPP fluxes, which are extrapolated to the pan-Arctic using a land cover map-based weighting function. Parameter estimation from direct flux measurements over a wide range of vegetation types reproduces site-level NEE cycles with reasonable fidelity, and bootstrapping simulations provide uncertainties on carbon flux estimates. Our range of flux estimates also agrees well with independent NEE estimates derived from NOAA’s Carbon-Tracker. Polar-VPRM parameters were also tuned using atmospheric inversion model-derived NEE and GPP fluxes, which were constrained by thousands of high-accuracy and high-precision in situ atmospheric CO2 and COS observations that have much larger footprints than EC flux-tower measurements.
High-latitude amplification of the CO2 seasonal cycle has been well documented in long-term atmospheric observations since the 1960s. However, understanding the cause of the increasing amplitude remains challenging. Candidate theories include warming-induced earlier onset of vegetation growth and enhanced respiration in the fall, as well as mid-latitude transport of signals from increased agriculture production. We leverage NASA’s ABoVE data products, satellite-derived solar induced fluorescence (SIF) and state-of-the-science empirical and inverse modeling capabilities to partition net ecosystem exchange (NEE) into gross primary productivity (GPP) and respiration. A simple, empirical framework was constructed with the Polar Vegetation Photosynthesis and Respiration Model (Polar-VPRM), which uses reanalysis climatology from ERA5, satellite-based SIF and eddy covariance (EC) flux tower measurements to estimate parameters corresponding to each vegetation type documented by Ameriflux and Fluxnet sites across the Arctic. These parameters are then used to calculate GPP fluxes, which are extrapolated to the pan-Arctic using a land cover map-based weighting function. Parameter estimation from direct flux measurements over a wide range of vegetation types reproduces site-level NEE cycles with reasonable fidelity, and bootstrapping simulations provide uncertainties on carbon flux estimates. Our range of flux estimates also agrees well with independent NEE estimates derived from NOAA’s Carbon-Tracker. Polar-VPRM parameters were also tuned using atmospheric inversion model-derived NEE and GPP fluxes, which were constrained by thousands of high-accuracy and high-precision in situ atmospheric CO2 and COS observations that have much larger footprints than EC flux-tower measurements.
Regional scale patterns of remotely sensed methane hotspots with respect to Arctic lake change and thermokarst geomorphology (Clayton Elder)
Theme: Crosscutting (Mon 17:00 - 18:00)
- Poster #
21
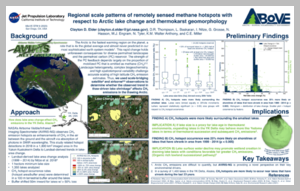
Clayton Elder (1), David Thompson (2), Latha Baskaran (3), Ingmar Nitze (4), Guido Grosse (5), Nicholas Hasson (6), Melanie Engram (7), Natalie Tyler (6), Katey Walter Anthony (7), Charles Miller (3)
Jet Propulsion Laboratory (1), Jet Propulsion Laboratory / Caltech (2), NASA JPL (3), Alfred Wegener Institute for Polar and Marine Research (4), Alfred Wegener Institute Helmholtz Centre for Polar and Marine Research (5), University of Alaska Fairbanks (6), University of Alaska, Fairbanks (7)
Arctic and boreal wetlands and lakes are experiencing complex ecological changes as a result of warming. The potential for rapidly thawing permafrost to promote large increases in methane (CH4) emissions via ground subsidence and ponding (thermokarst), and permafrost carbon mineralization is of particular concern for accelerating the permafrost carbon feedback (PCF) [Turetsky et al. 2020]. However, complex hydrological dynamics produce large uncertainties for the sign and magnitude of carbon loss in modeling and forecasting efforts. Determining CH4’s current and future contributions to the PCF is challenging due to sparse observations, high spatiotemporal variability, and heterogeneous Arctic landscapes. As a result, top-down (observation-based) and bottom-up (model/inventory-based) evaluations of annual Arctic and boreal CH4 emissions disagree by 50-200% [McGuire et al. 2012; Peltola et al. 2019]. Constraining the current budget and forecast uncertainty in future Arctic emissions will require scale-bridging approaches that reconcile high spatiotemporal variability and regional to continental scale coverage. To this end, we compiled multiple large remote sensing datasets to study relationships between Landsat-derived Arctic lake and thermokarst landscape morphology trends with remotely-sensed (AVIRIS-NG) CH4 emission hotspot detections. Preliminary analyses from a lake-and-wetland-rich 1,750 km2 study area of the Yukon Kuskokwim Delta, AK, USA reveal discrete correlations between recently wetted areas and CH4 hotspot detections. However, in an analysis of over 1,200 lakes > 1 ha, hotspots were detected in greater abundance surrounding lakes that have shrunk in area since 1999 (p < 0.05) (Fig. 1). Our preliminary results imply a complex response of CH4 emissions surrounding dynamic permafrost environments. Ongoing analyses seek to further elucidate patterns related to waterbody size, permafrost ice content, and discrete thermokarst features.
Arctic and boreal wetlands and lakes are experiencing complex ecological changes as a result of warming. The potential for rapidly thawing permafrost to promote large increases in methane (CH4) emissions via ground subsidence and ponding (thermokarst), and permafrost carbon mineralization is of particular concern for accelerating the permafrost carbon feedback (PCF) [Turetsky et al. 2020]. However, complex hydrological dynamics produce large uncertainties for the sign and magnitude of carbon loss in modeling and forecasting efforts. Determining CH4’s current and future contributions to the PCF is challenging due to sparse observations, high spatiotemporal variability, and heterogeneous Arctic landscapes. As a result, top-down (observation-based) and bottom-up (model/inventory-based) evaluations of annual Arctic and boreal CH4 emissions disagree by 50-200% [McGuire et al. 2012; Peltola et al. 2019]. Constraining the current budget and forecast uncertainty in future Arctic emissions will require scale-bridging approaches that reconcile high spatiotemporal variability and regional to continental scale coverage. To this end, we compiled multiple large remote sensing datasets to study relationships between Landsat-derived Arctic lake and thermokarst landscape morphology trends with remotely-sensed (AVIRIS-NG) CH4 emission hotspot detections. Preliminary analyses from a lake-and-wetland-rich 1,750 km2 study area of the Yukon Kuskokwim Delta, AK, USA reveal discrete correlations between recently wetted areas and CH4 hotspot detections. However, in an analysis of over 1,200 lakes > 1 ha, hotspots were detected in greater abundance surrounding lakes that have shrunk in area since 1999 (p < 0.05) (Fig. 1). Our preliminary results imply a complex response of CH4 emissions surrounding dynamic permafrost environments. Ongoing analyses seek to further elucidate patterns related to waterbody size, permafrost ice content, and discrete thermokarst features.
Publish your data at the ORNL DAAC (Tammy Walker)
Theme: Other (Mon 17:00 - 18:00)
- Poster #
23
Tammy Walker (1), Yaxing Wei (1), Debjani Singh (1), Michele Thornton (2), Bruce Wilson (1)
Oak Ridge National Laboratory (1), ORNL DAAC (2)
The mission of the ORNL DAAC is to assemble, distribute, and provide data services for a comprehensive archive of terrestrial biogeochemistry and ecological dynamics observations and models to facilitate research, education, and decision-making in support of NASA's Earth Science. The ORNL DAAC archives data products generated from the NASA Terrestrial Ecology program and other programs within the NASA Carbon Cycle and Ecosystems focus area, and continues to serve as the archive of record for data products produced from the Arctic-Boreal Vulnerability Experiment (ABoVE).
[poster]
The mission of the ORNL DAAC is to assemble, distribute, and provide data services for a comprehensive archive of terrestrial biogeochemistry and ecological dynamics observations and models to facilitate research, education, and decision-making in support of NASA's Earth Science. The ORNL DAAC archives data products generated from the NASA Terrestrial Ecology program and other programs within the NASA Carbon Cycle and Ecosystems focus area, and continues to serve as the archive of record for data products produced from the Arctic-Boreal Vulnerability Experiment (ABoVE).
In the Clouds or on the Ground: Compute and Data Access Options for ABoVE Researchers (Bruce Wilson)
Theme: Other (Mon 17:00 - 18:00)
- Poster #
25
Bruce Wilson (1), Chris Lindsley (1), Rupesh Shrestha (1), Debjani Singh (1), Michele Thornton (1), Tammy Walker (1), Yaxing Wei (1), Jessica Welch (1), Daine Wright (1)
Oak Ridge National Laboratory (1)
This poster will present options available to ABoVE researchers for accessing data and compute resources. Those resources include the ABoVE Science Cloud, Earthdata Cloud, the Science Managed Cloud Environment, and local computing resources at your home institution. Different compute environments have different data available and are better for different kinds of computing, as well as different levels of assistance available from the ABoVE program. This poster will present some of those resources, our understanding of the tradeoffs, as well as where to go for more information about these resources. We will also cover where to find learning resources to help take best advantage of these capabilities.
This poster will present options available to ABoVE researchers for accessing data and compute resources. Those resources include the ABoVE Science Cloud, Earthdata Cloud, the Science Managed Cloud Environment, and local computing resources at your home institution. Different compute environments have different data available and are better for different kinds of computing, as well as different levels of assistance available from the ABoVE program. This poster will present some of those resources, our understanding of the tradeoffs, as well as where to go for more information about these resources. We will also cover where to find learning resources to help take best advantage of these capabilities.
As ABoVE so below - how the 2022 ABoVE Airborne Campaign engaged community members on the ground. (Bruno Lecavalier)
Theme: Other (Mon 17:00 - 18:00)
- Poster #
27
Bruno Lecavalier (1), Oliver Sonnentag (1), Léa Cornette (1)
Université de Montréal (1)
In late August 2022, the ABoVE Airborne campaign visited the Inuvialuit Settlement Region in the Northwest Territories, Canada. NASA’s Gulfstream III (AFRC) flew a microwave radiometer (L-Band) above the Mackenzie Valley to gather data on ground properties such as active layer depth, soil moisture and canopy structure. On its way to Tuktoyaktuk, a small coastal community nested where the land meets the Arctic Ocean, the flight intersected two established research sites: Trail Valley Creek research station, in the Arctic tundra, and Havikpak Creek, a sub-arctic woodland. Meanwhile, 41000 feet below, a team of two Inuvialuit residents of Inuvik, NWT, Canada and two Université de Montréal students visited these sites. The goal: gather ground truthing data destined for the calibration and validation of the measurements taken onboard. In a race against the rain, the campaign spanned five days and the team was able to acquire much data on various ground and ecological properties. The key to this field campaign's success was the integration of the team members' respective experiences, knowledge and grit. For one, the students provided needed insight on the use of scientific equipment, while the Inuvialuit residents brought essential information as to the land, which was crucial to characterize the plots. Notwithstanding the scientific objectives this campaign supported, perhaps the main achievement of this effort lies in the scientific fieldwork training that the Inuvialuit residents acquired. In line with current efforts to build capacity in the Inuvialuit Settlement Region, this campaign showed how ABoVE could contribute towards establishing field research capabilities in the local community.
In late August 2022, the ABoVE Airborne campaign visited the Inuvialuit Settlement Region in the Northwest Territories, Canada. NASA’s Gulfstream III (AFRC) flew a microwave radiometer (L-Band) above the Mackenzie Valley to gather data on ground properties such as active layer depth, soil moisture and canopy structure. On its way to Tuktoyaktuk, a small coastal community nested where the land meets the Arctic Ocean, the flight intersected two established research sites: Trail Valley Creek research station, in the Arctic tundra, and Havikpak Creek, a sub-arctic woodland. Meanwhile, 41000 feet below, a team of two Inuvialuit residents of Inuvik, NWT, Canada and two Université de Montréal students visited these sites. The goal: gather ground truthing data destined for the calibration and validation of the measurements taken onboard. In a race against the rain, the campaign spanned five days and the team was able to acquire much data on various ground and ecological properties. The key to this field campaign's success was the integration of the team members' respective experiences, knowledge and grit. For one, the students provided needed insight on the use of scientific equipment, while the Inuvialuit residents brought essential information as to the land, which was crucial to characterize the plots. Notwithstanding the scientific objectives this campaign supported, perhaps the main achievement of this effort lies in the scientific fieldwork training that the Inuvialuit residents acquired. In line with current efforts to build capacity in the Inuvialuit Settlement Region, this campaign showed how ABoVE could contribute towards establishing field research capabilities in the local community.